
WHAT’S NEW IN VERSION 2024
1. New Speaker Tag Retrieval and Automatic Utterance Coding Tool
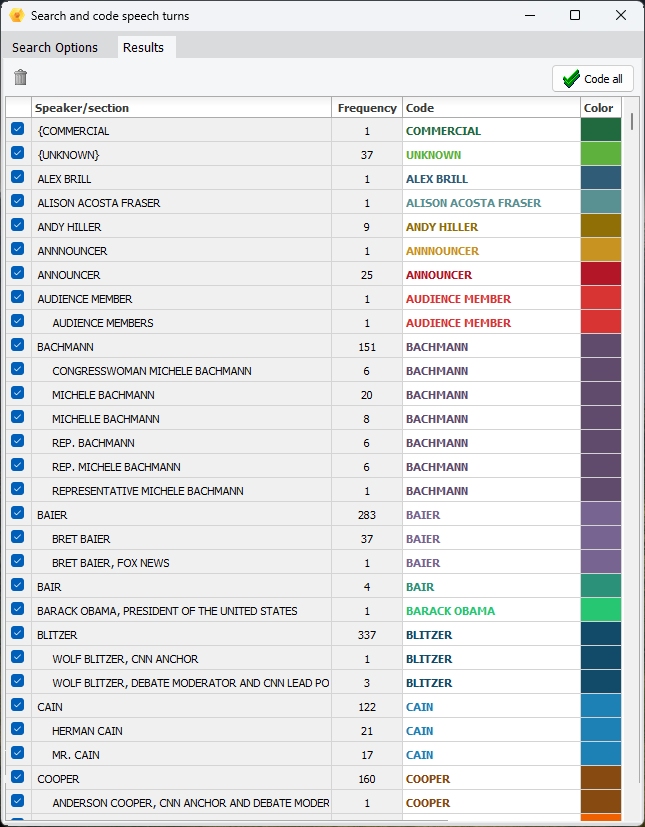
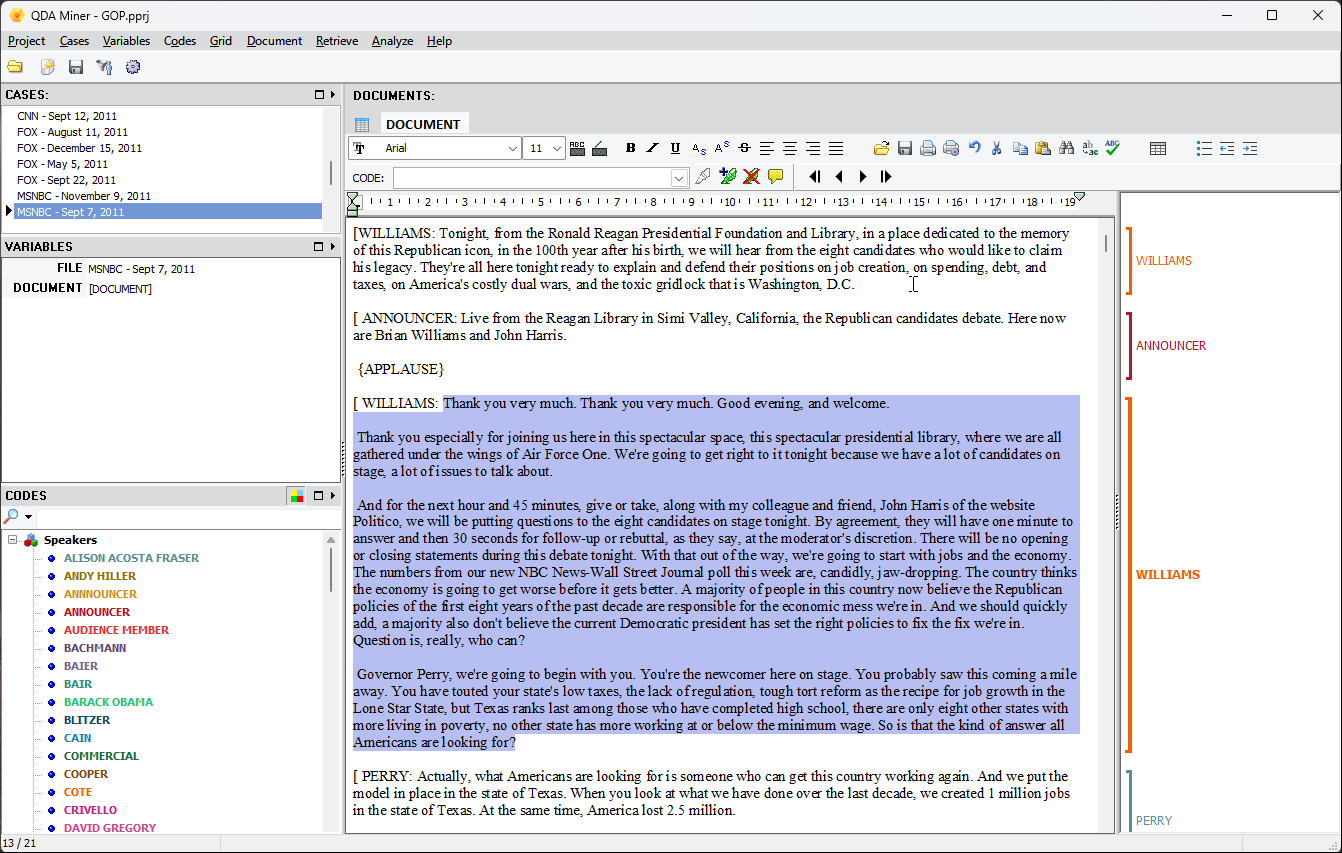
A new retrieval tool allows one to extract speaker labels from interview, focus groups, or debate transcripts, allowing one to automatically code utterances from all or selected speakers. The advance processing recognizes common variations in the labels used to refer to a specific speaker (common in public debate transcripts) and group them automatically. The user may then edit the generated code name for speakers as well as the assigned color, remove or disable specific labels. This new retrieval tool may also be used to automatically identify repetitive elements in forms or structured reports and apply codes them.
2. Phrase Frequency Analysis
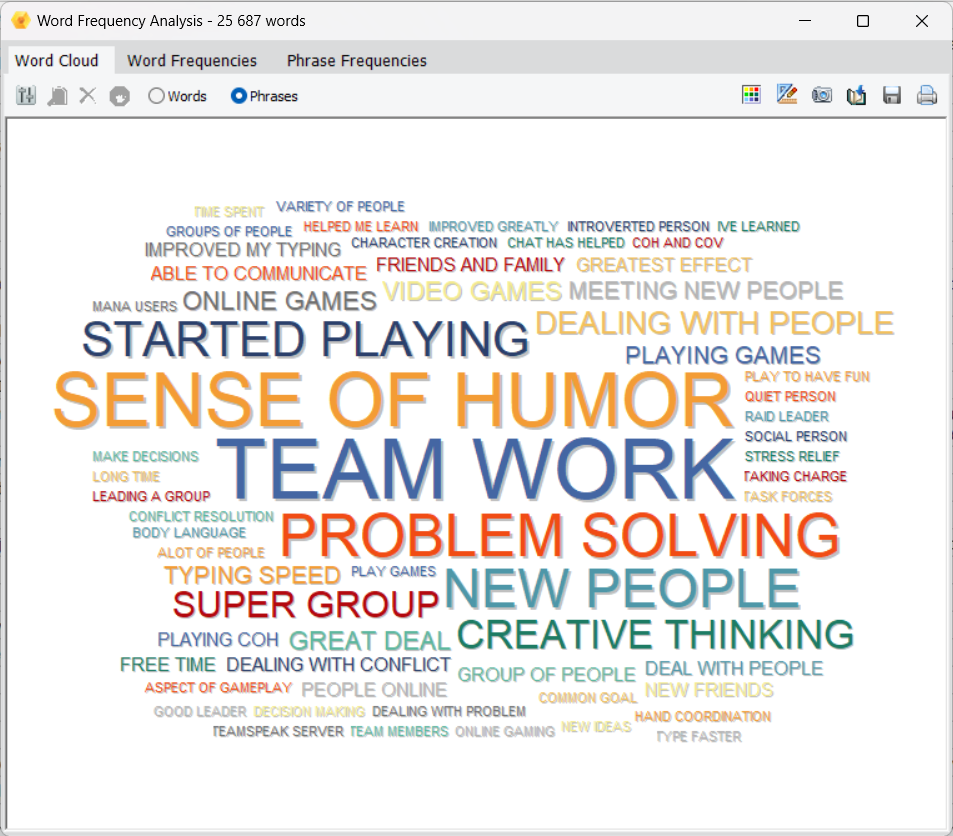
The interactive word clouds and word frequency tables have been improved to display the most common phrases, extracting some themes as well as common idioms and expressions. Such a list can be obtained on any document variable or on results of retrieval operations (text, coding, section or keyword retrieval) . One may tailor the “phrase cloud” (font, color, shape, etc.), move selected phrases to the stop word list, or perform text searches from the obtained graphic or table representation.
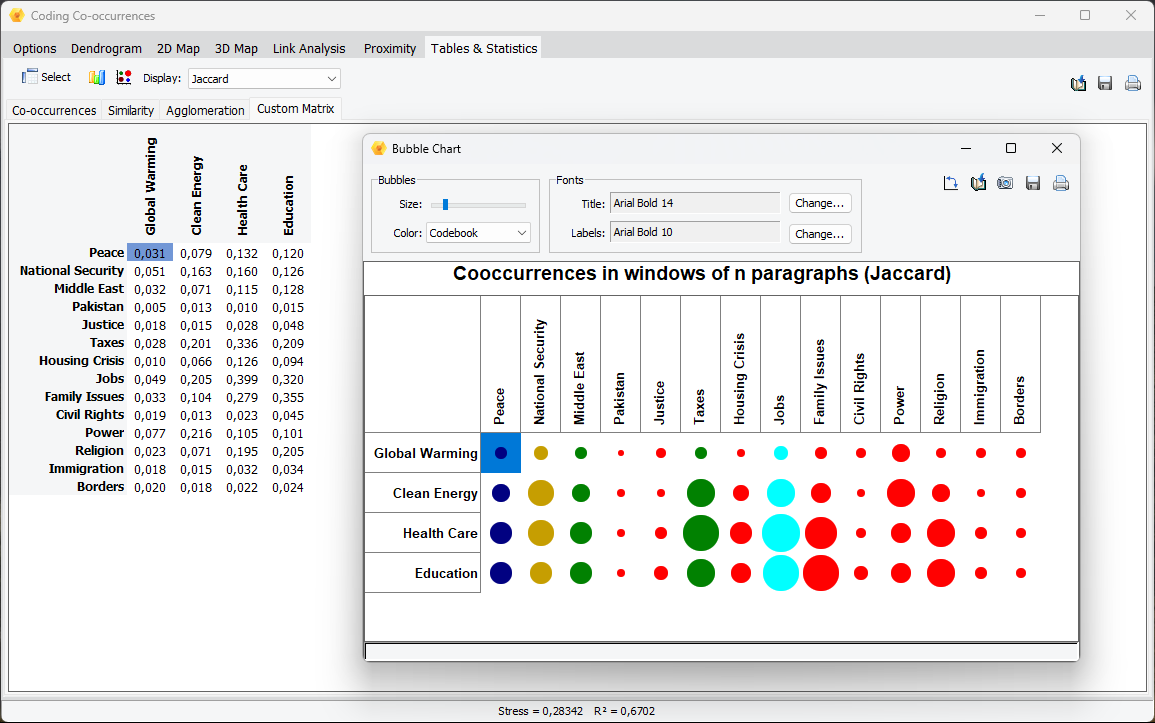
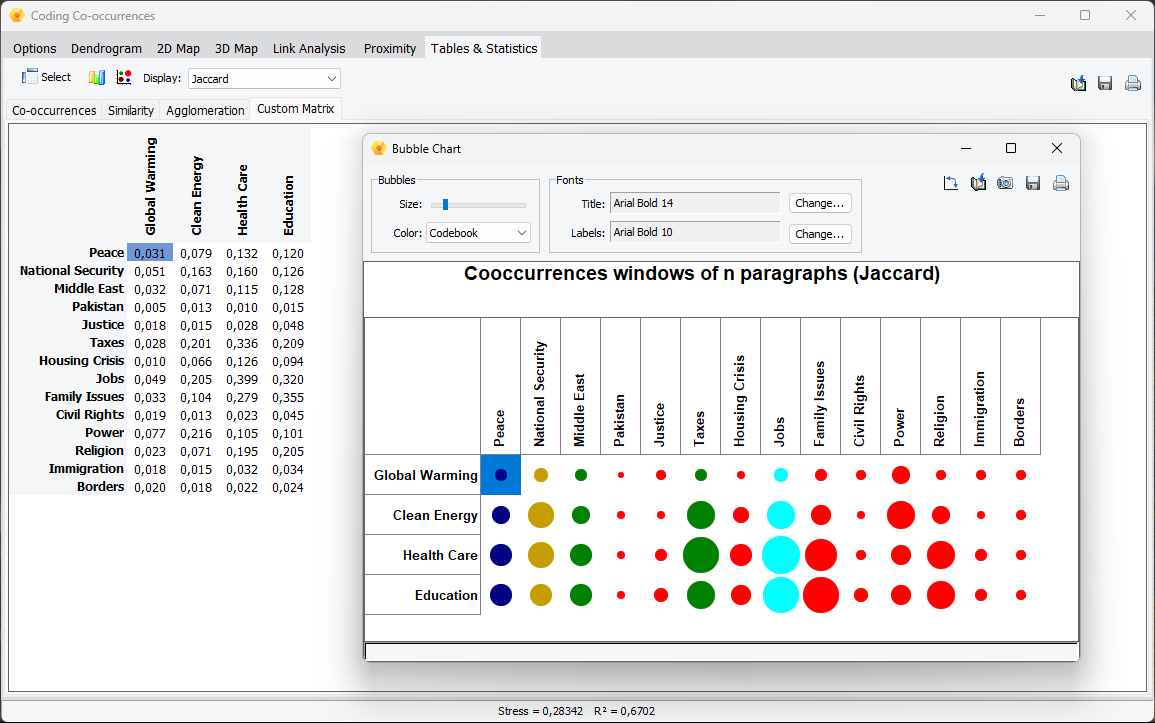
3. Create Custom Cooccurrences and Similarity Matrix and Graphics
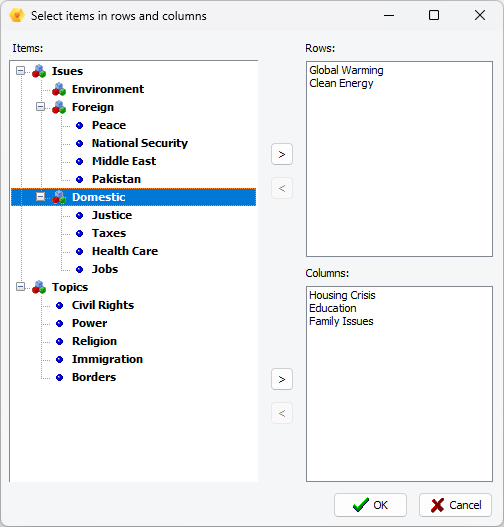
A new set of options have been added to the Cooccurrence and the Code Similarity dialog boxes, allowing one to create custom tables comparing user defined sets of codes or cases. One may choose among seven statistics to be displayed in the resulting table, and then create various graphic representations of the obtained table, including bubble charts, bar charts, line charts, and area charts.
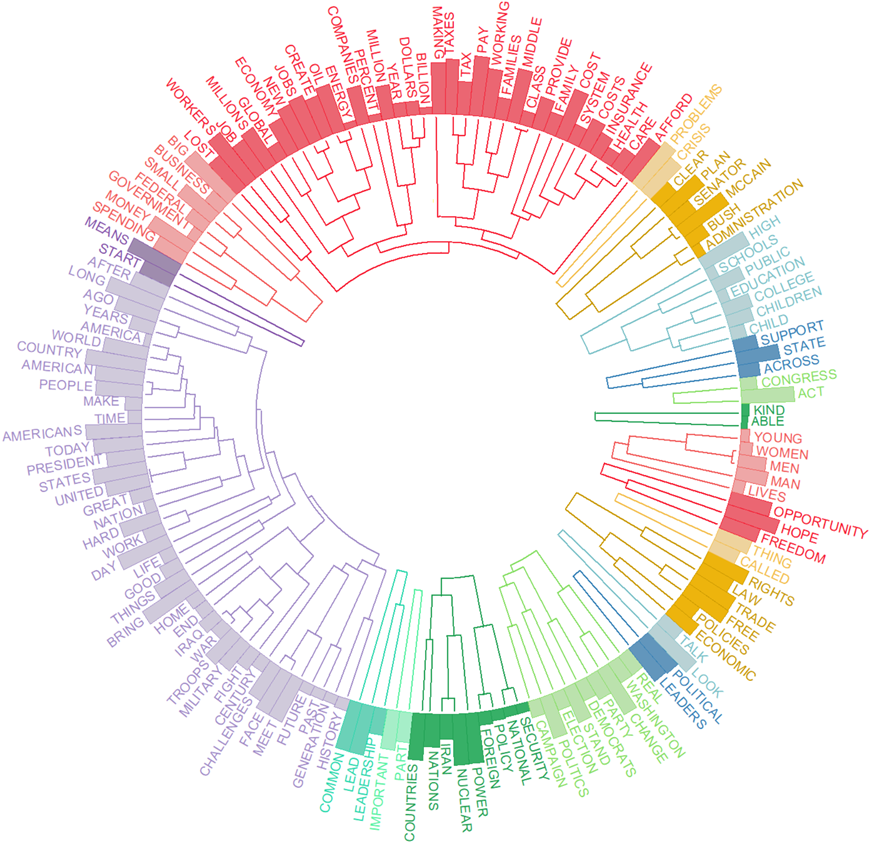
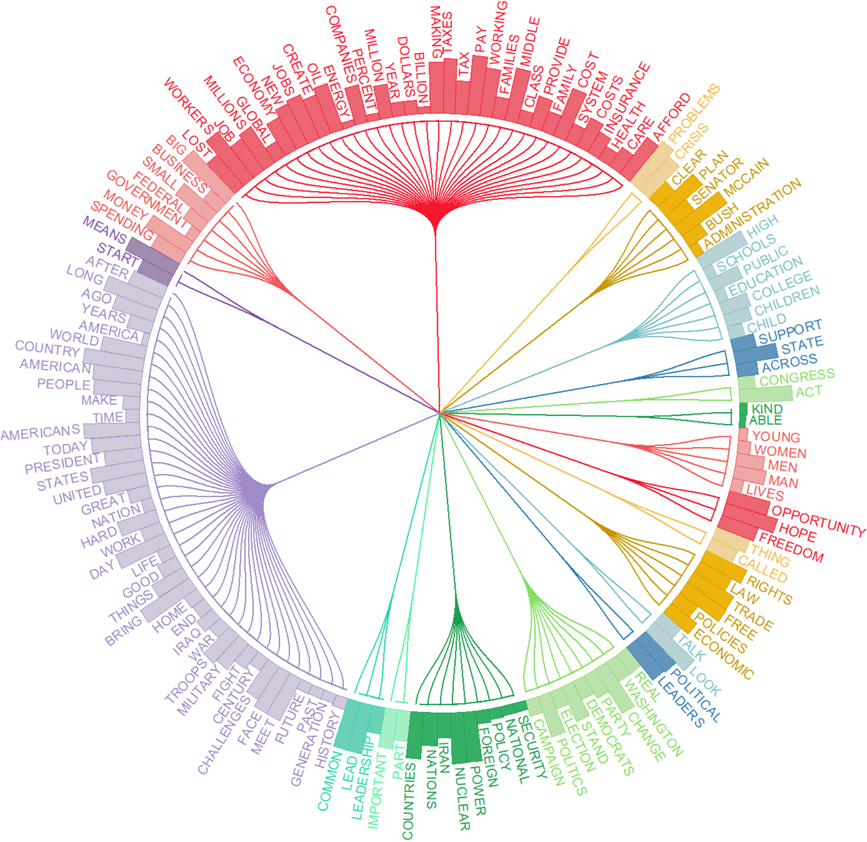
4. Circular Dendrograms
The new circular dendrograms use space more efficiently than vertical ones. In a vertical dendrogram, the height of the dendrogram can become quite large, requiring more vertical space to display. Circular dendrograms, on the other hand, arrange the branches in a circle, making more efficient use of space. Circular dendrograms may be more aesthetically pleasing and can be more visually appealing in presentations and publications.
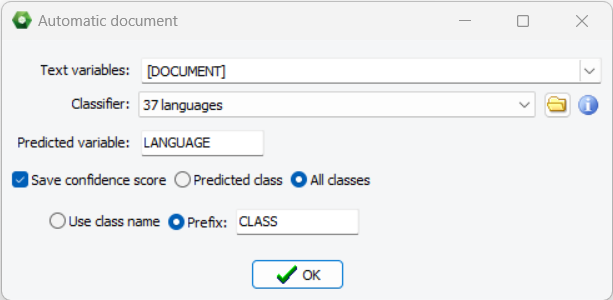
5. Apply Automatic Document Classification Models to Project Data
QDA Miner 2024 now allows the application of automatic document classification models for data transformation. This new feature facilitates the storage of predicted classes in a variable. Users can also opt to store the probability of the predicted class or probabilities of all classes.
6. Copy Graphics’ Data to the Clipboard in Text Format
It is now possible to save data utilized for creating various graphics to the clipboard in tab-delimited format. One may then seamlessly paste the data in another application to generate tables or custom charts.
7. New Automatic Language Detection Model
QDA Miner 2024 now includes new language identification classification model that can identify 37 languages accurately (most languages using Latin, Arabic or Cyrillic characters). It’s measured accuracy is above 97% on very small text segments (five words or less) and above 99.5% on longer documents. The classification model may be applied to create a language variable in a multilingual project, allowing one to filter and analyze different languages separately.
WHAT’S NEW IN VERSION 2023
1. New File format for Full Unicode Support
QDA Miner now supports WordStat’s .pprj file format allowing improved support for all human languages. While the prior version of QDA Miner could be used to analyze text in almost any language, string variables and codes could only be written using ANSI characters associated with the Windows code page. Version 2023 remove such limitation. When an existing .ppj file is open, QDA Miner 2023 will ask to convert the current project into the new format. A new project file with the same name and in the same location but with a .pprj file extension will be created, keeping the original .ppj file untouched. If needed, one may still work on or export to the prior .ppj file format.
2. Importation of QDA Miner Lite 3.0 Project Files
Like QDA Miner 2023, the QDA Miner Lite 3.0 free software now fully support Unicode and store data in a new file format with a .qlt file extension. QDA Miner 2023 can now import this new .qlt file format as well as the .qdp files created with versions 1.x and 2.x of QDA Miner Lite.
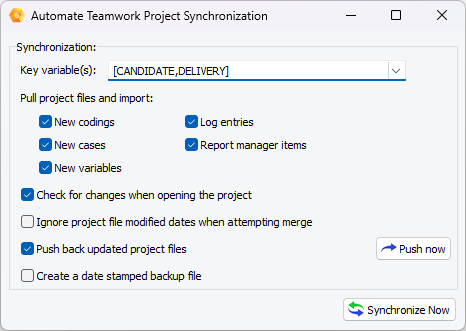
3. Automatic Synchronization Feature for Teamwork
Some large-scale qualitative projects may involve multiple coders working on the same set of data simultaneously. The synchronization feature allows the project administrator to automate the entire process of distributing, retrieving, merging and sending back projects to all team members with a single click of a button.
4. New Redact Features for Removing Sensitive Information
QDA Miner offers two methods for removing confidential or sensitive information from coded texts: a destructive method and a non-destructive method. In the destructive method, the text to be obliterated is replaced with black rectangles. On the other hand, the non-destructive method involves masking the text by displaying it with a black font on a black background. When using the non-destructive method, only the display in the main document window is affected. No information is lost, and users can easily view the hidden text by selecting it in the document window. The redacted text remains visible as well when retrieved from any of the search function in QDA Miner, allowing users to see the full text. The non-destructive method is especially useful when printing hard copies of documents with sensitive information blacked out.
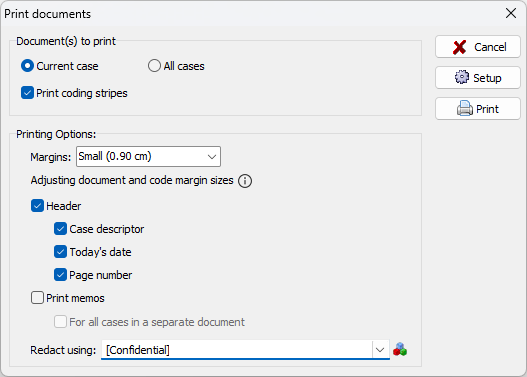
5. Printing of Documents with Code Marks and Memos
There are some situations where one may need to produce a printed copy of documents along with existing codings and memos such as when one needs to include coded documents in a report or have the coding reviewed by another team member. QDA Miner 2023 allows one to print either the current document or all documents with options to set different margin sizes, redact some text segments, set a header with the case descriptor, the current date, and page numbers, and print memos either at the end of the document or, when printing all documents, on separate pages.
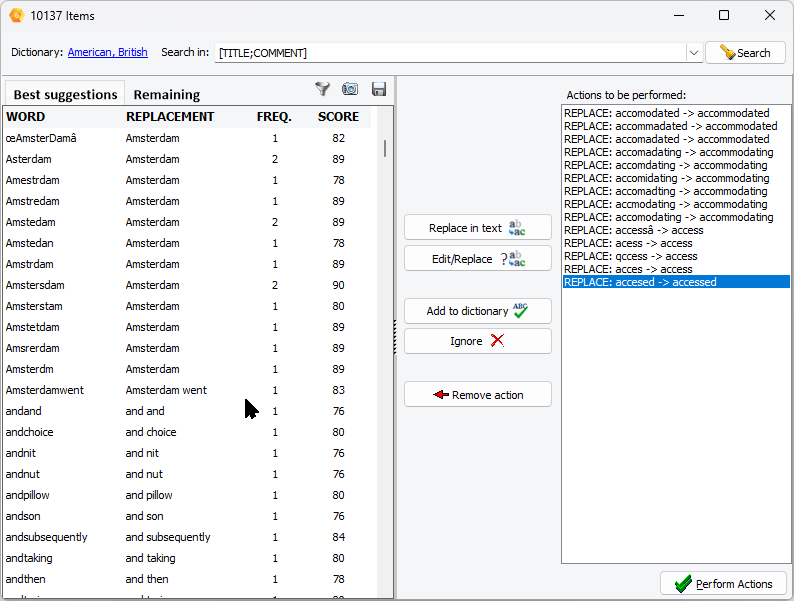
6. Fast Semi-Automatic Spelling Correction
QDA Miner now offers a very efficient way to identify and correct all misspelled words in a project. This semi-automatic process will go through all documents of the projects and identify all words that are not in the selected spelling dictionary. It will also automatically offer suggested replacements for most of the words taking into account not only the similarity with a known word but its presence and frequency into the corpus being analyzed. It will even attempt to suggest spelling corrections for words that may not be in the spelling dictionary, such as proper nouns, technical terms, or neologisms.
7. Importation of 10-K and 10-Q Financial Filings
A new importation routine enables users to import specific sections of 10-K and 10-Q financial filings, and store them separately or merge them into single documents. The extraction routine automatically recognizes the company’s name, time period (quarter and year), and stores them as variables for easy analysis.
8. Export Qualitative Analysis Results to Power BI
QDA Miner now offers seamless integration with Microsoft Power BI, allowing users to export text analysis results and metadata to Power BI Desktop for interactive dashboards and reports. By exporting qualitative analysis results and metadata to Power BI Desktop, users can create compelling visualizations, gain deeper insights from their data, and easily share their findings with others.
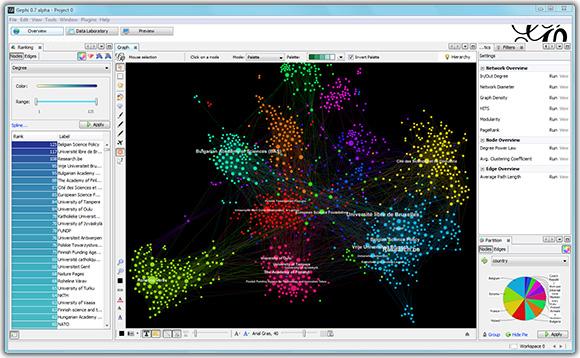
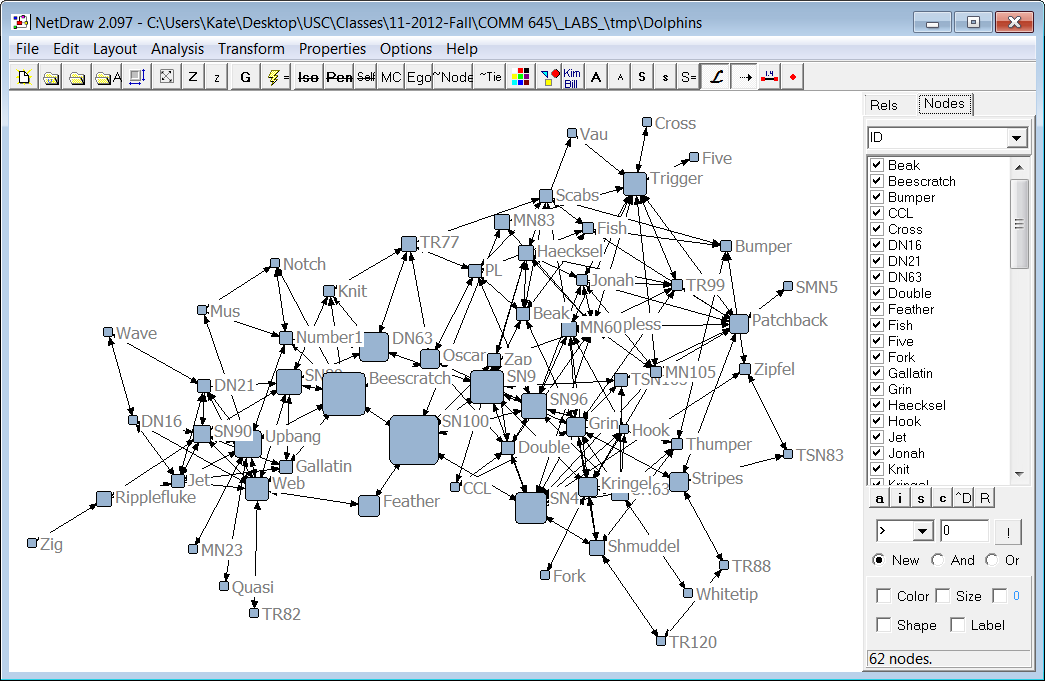
9. Push Co-occurrence Data to Gephi or NetDraw.
With the new option available from the Dendrogram page, users can now export co-occurrence data, along with additional information such as frequency and cluster number, to social network analysis software like Gephi and NetDraw. These tools provide powerful visualizations that help users identify patterns and relationships within their data. Gephi offers layout algorithms and interactive features for real-time exploration, while NetDraw provides visualization options for network graphs.
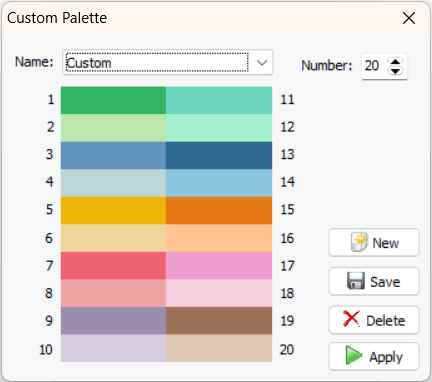
10. Custom Chart Palettes
QDA Miner 2023 introduces a new feature that allows users to create custom color palettes. This feature provides greater control over the colors used for charts, word clouds, clustering, and other visualizations, enabling users to customize their output to suit their specific needs.
11. Enhanced Cluster Extraction Settings
Buttons may now be used to tight or loose the criteria used for grouping resulting in either less or more items being clustered together.
12. Improved Coding Retrieval Dialog Feature
The coding retrieval feature now includes buttons to add a memo to a coded segment, edit or delete such a memo as well as change or remove the code associated with a specific text segment.
13. Improved Memo Retrieval Dialog Box
The memo retrieval dialog box now includes buttons to add a memo to a coded segment, edit or delete such a memo as well as change or remove the code associated with a specific text segment.
WHAT’S NEW IN VERSION 6.0
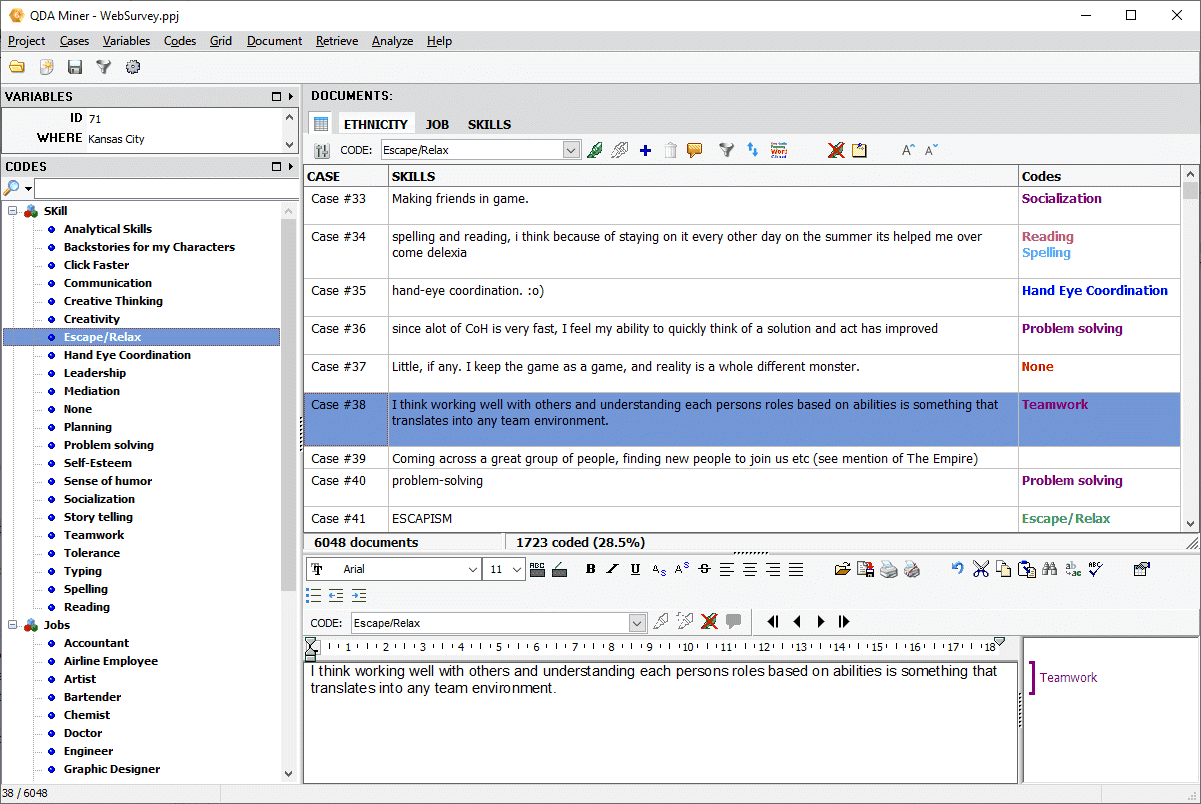
1. New Grid view mode for coding short responses
While appropriate for coding long documents, the standard document/case centric view of QDA Miner was less suited for coding short text responses such as response to open-ended questions or short comments. Now, QDA Miner 6 introduces a new grid view mode that provides a convenient and very efficient way to code this kind of text data. It is useful for everyone coding any type of open-ended comments, including surveys, employee comments, customer comments and allows one to quickly identify trends in a survey or major support issues that need to be addressed. It includes features such as:
- Drag-and-drop coding and annotation.
- Filtering of responses using text search expressions with Boolean operators
- Filtering of responses based on the number of codes (uncoded, coded, more than n codes, etc.) as well as on the presence or absence of specific codes.
- Sorting of rows either alphabetically, on text length, number of codes, or case number.
- Displays the number and percentage of coded responses,
- Computation of word clouds and word frequency analysis on text currently displayed in the grid.
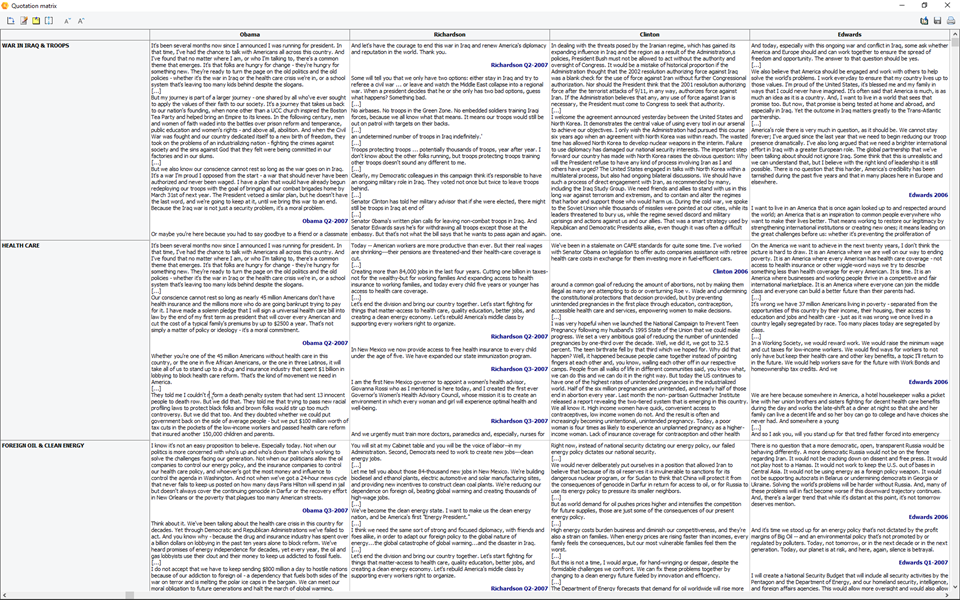
2. Quotation Matrices
The quotation matrix allows you to create a large grid containing all coded text segments and/or comments where each cell represents the intersection of a specific code with either a specific case or a value of a categorical or numerical variable (age group, gender, source, etc.). Such a joint display provides a compact view of coded material ideal for reviewing work done by coders. More easily identify patterns, creating dense summaries of results, etc. This matrix may be created from the new RETRIEVAL | QUOTATION MATRIX command to obtain a codes x cases quotation matrix or from the ANALYSIS | CODING BY VARIABLES command for displaying coded materials by all values of a variable. It supports the following features:
- Displays either all comment types or specific ones based on subject, speaker etc.
- Text in each cell can be edited in with a rich text editor (font style, size and color, paragraph formatting, etc.)
- Multiple memos can be attached to individual cells.
- Rows and columns may be transposed.
- The matrix can be exported to disk in various formats, including Excel, CSV, TSV and a new PGRD format allowing one to review and edit the table outside of QDA Miner using a free grid viewer/editor.
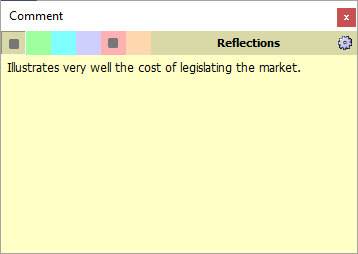
3. Enhanced annotation feature
It is now possible to attach up to six types of comments to a single code mark. Annotations may serve different purposes such as formulating hypothesis, communicating concerns with team members, summarizing, etc. You are no longer restricted to a single comment type. The removal of such limitation and the introduction of the quotation matrix feature (see above) offers new possibilities for generating condense view of summaries, concerns, hypotheses, etc. It gives you much more flexibility on how to instruct, explain codes, pose, and answer questions.
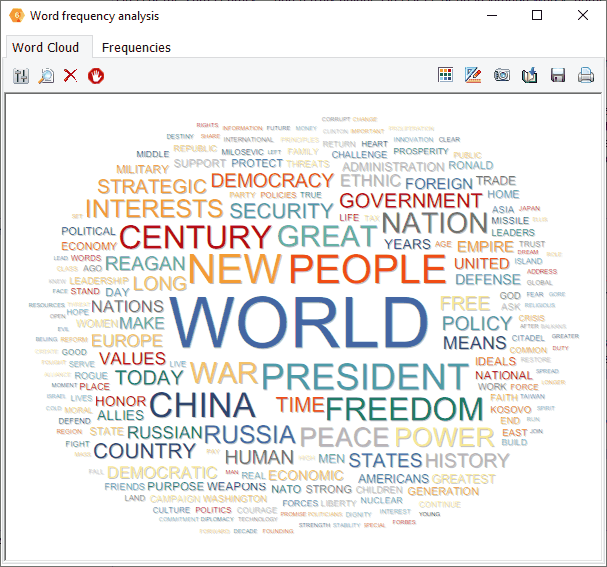
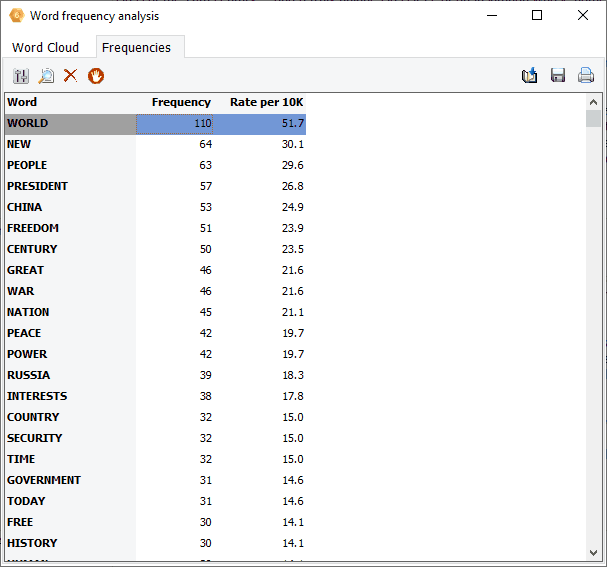
4. Word Frequency Analysis and Word Cloud
Interactive word clouds and word frequency tables can now be obtained on any document variable or on results of retrieval operations (text, coding, section or keyword retrieval) as well as for a single document or for text displayed in the new grid view. One may tailor the word cloud (font, color, shape, etc.), customize stop words lists and perform text searches from it or from the associated word frequency table.
5. Importation of Nexis UNI and Factiva Files
It is now possible to import news transcripts from the LexisNexis and Factiva output files. After selecting one or multiple .DOCX or RTF files obtained from those services, QDA Miner will extract and store in separate variables the title and body of the news transcript, its source, the publication date, and other relevant information. Such a feature should prove useful for reputation management, brand management, crisis communication, media framing analysis, comparative media studies, etc.


6. Improved Importation of Excel, CSV and TSV files.
When importing files from Excel, CSV or TSV files a new wizard dialog box will allow you to select variables, rename them, import variable description, and perform batch data type conversions This gives you greater flexibility to set up your analysis, make it more precise and start it more quickly, saving time and resources.
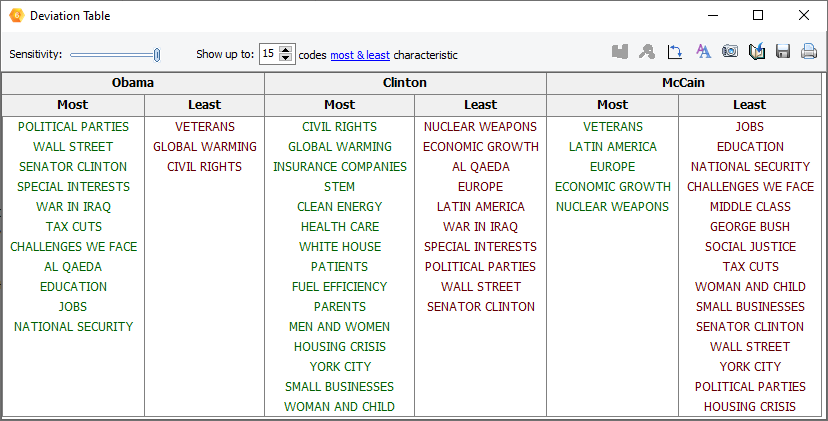
7. Deviation Table
The CODING BY VARIABLES feature now offers the possibility to produce a deviation table that allows one to obtain a list of codes most or least characteristic of different values of an independent variable as compared to other classes of this variable.
8. Export Results to Tableau Software
One can now export results to Tableau Software allowing one to use its advanced interactive data visualization tools. This feature is available from the CODING FREQUENCY and the CODING BY VARIABLES dialog boxes.

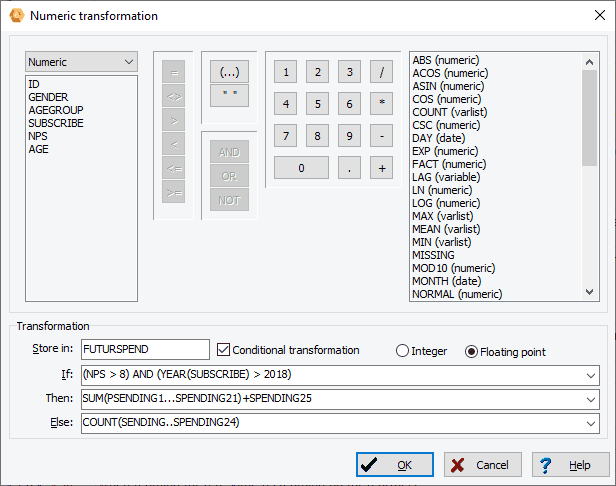
9. Numerical Transformation
A new numerical transformation dialog box allows you to compute numerical variables from other variables with up to 50 transformation functions including trigonometric, statistical, random number functions. Conditional transformation can also be performed using an IF-THEN-ELSE logical structure.
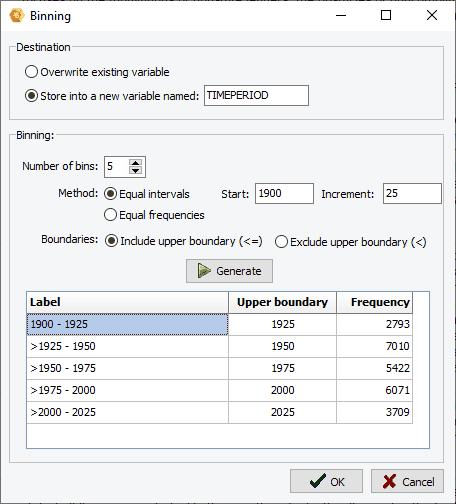
10. Binning
A binning feature can now be used to transform continuous values into a smaller number of distinct categories. It may be used to reduce the effect of numerical outliers, abnormal distributions, or convert a continuous numerical variable into an ordinal one. It is especially useful for creating graphic displays of comparisons when the number of distinct values in the numerical variable is too high.
11. Support of Missing Values
You can now associate to numerical, categorical, and short string variables up to three values that will be treated as missing data.
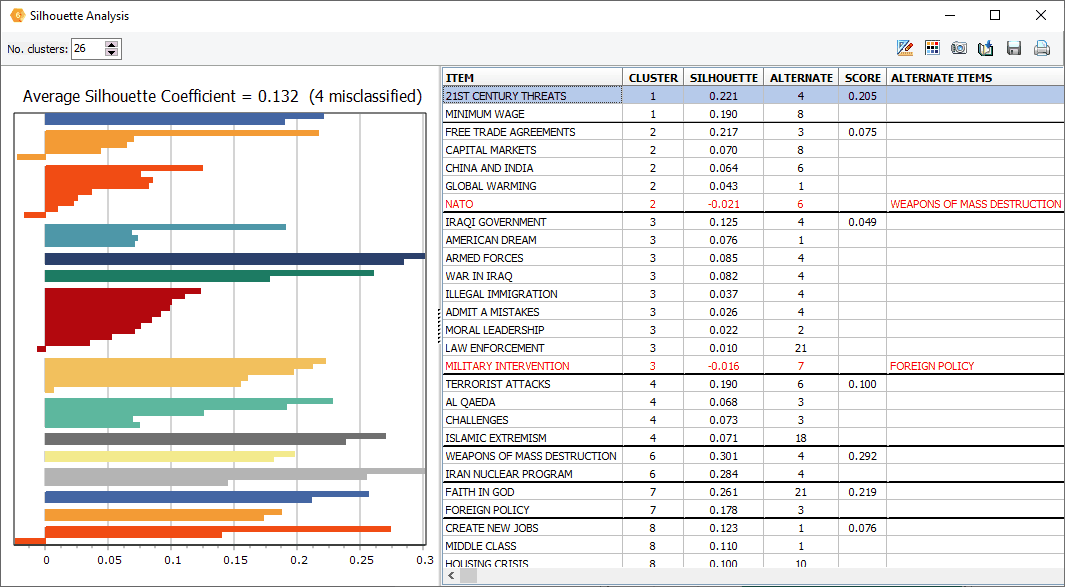
12. Silhouette plot
A new silhouette plot feature has been added to the hierarchical cluster analysis, allowing one to assess the quality of the cluster solution and identify potential misclassified items.
13. Date transformation
Date and date and time variables can now be used to create other categorical or numerical variables such as months, days or weekdays, months, years, etc.
![]()
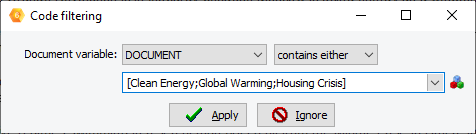
14. Improved code filtering feature.
The code filtering feature may now be used to filter cases based on the presence, the absence of specific codes or combinations of codes.
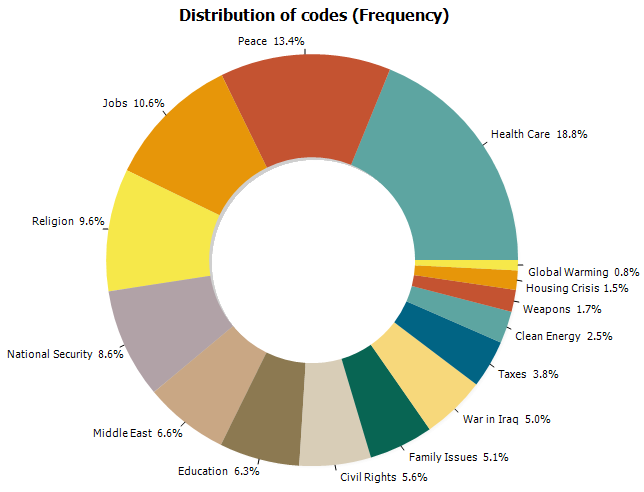
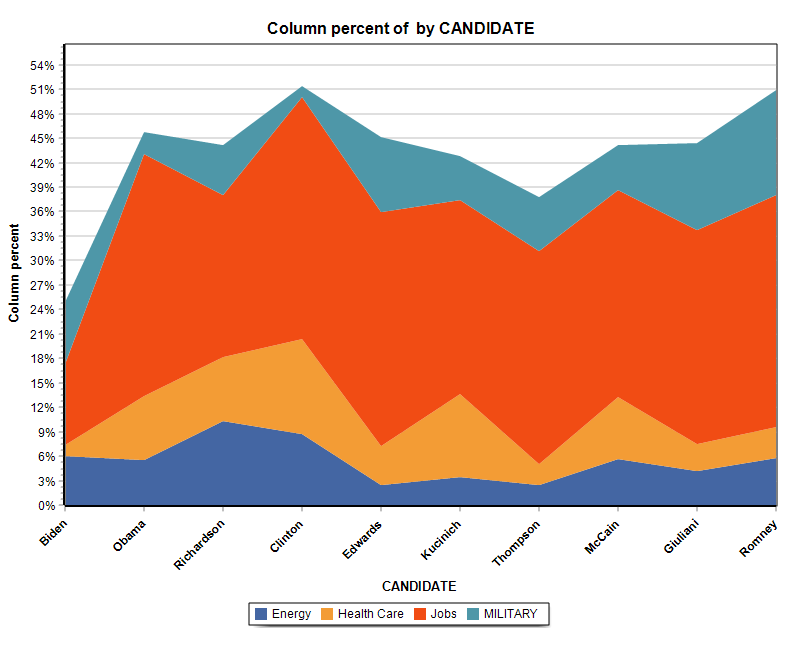
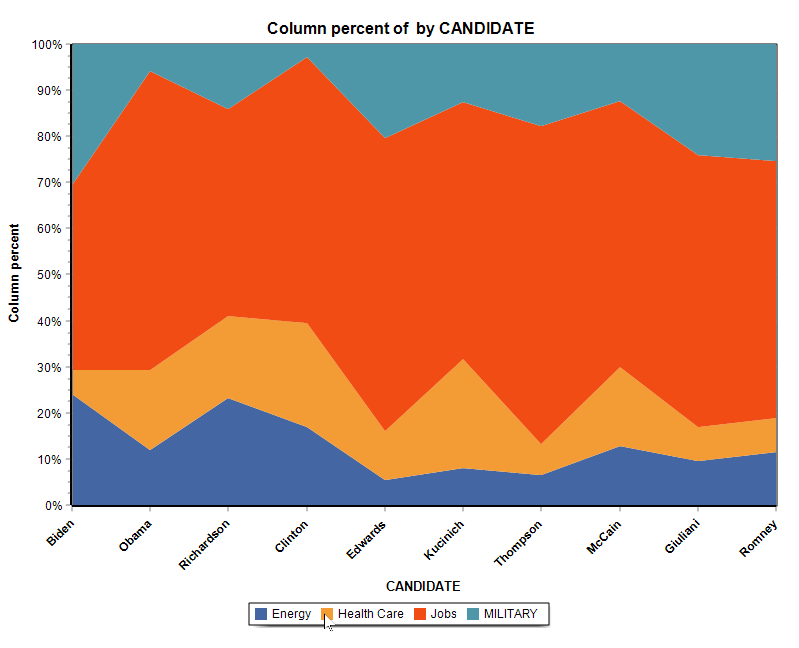
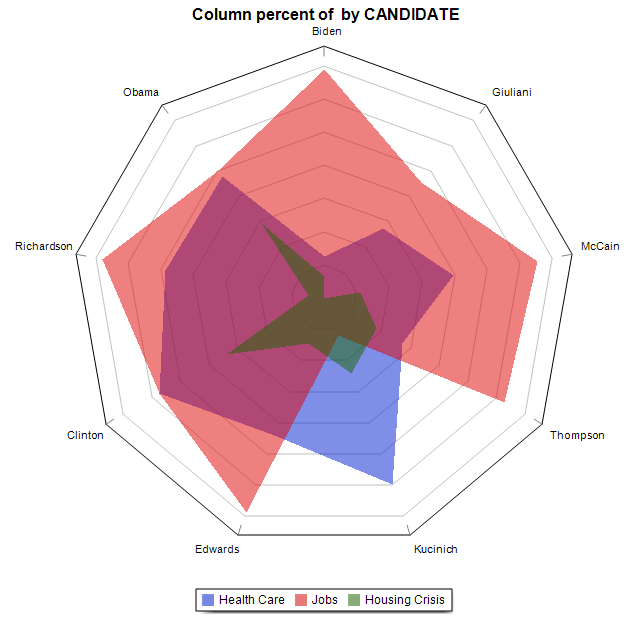
15. Donut, Radar, 100% Stacked Bar and Area Charts.
A donut chart can now be used to display relative codes or class frequencies (CODING FREQUENCY and VARIABLE STATISTICS dialog boxes). The charting feature of the CODING BY VARIABLES dialog box also adds the possibility to create a radar chart, a 100% stacked bar chart as well as two types of stacked area charts.
16. Ordering of series in comparison charts.
The relative position of a series of comparisons charts created from the CODING BY VARIABLES dialog box may now be manually adjusted, allowing you to achieve more appealing or revealing visualizations.
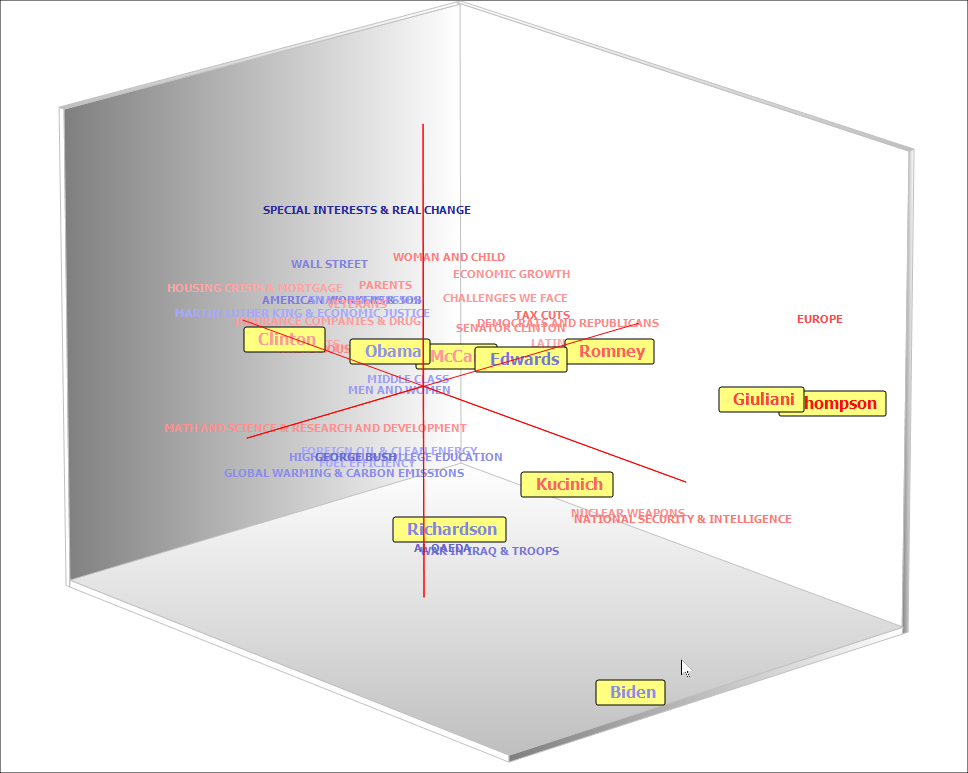
17. Color Coding of items in Correspondence Plot
Color gradients may now be used to represent the position of specific words or variable classes on the third (depth) dimension or 2D as well as 3D correspondence plot. Up to four colors may be chosen to create those gradients.
18. Improved Bubble Chart
It is now possible to transpose rows and columns of bubble charts and finely adjust the size of the bubbles.
19. Link Analysis Buffer
A link analysis buffer allows one to move back to previous link diagrams and then forward.
20. New Table Format and Table Editor
A new proprietary table format (*.pgrd) has been added to the exportation of tables to disk, allowing one to easily edit and annotate tables produced by QDA Miner. A free standalone table viewer may also be downloaded from our web site, allowing anyone to view, edit and annotate saved tables.
21. Numerous Additional Improvements
Several new options and interface improvements have been made to existing dialog boxes (code color selection, graphic options, etc.), management and analysis features.
Click here to see the changes introduced in version 5