A good example of QDA Miner’s analysis and visualization features December 1, 2017 - Blogs on Text Analytics
Mission statements are an important strategic management tool for many companies, large and small. Well crafted, they serve as a quick reference to internal and external stakeholders as to what a company is and what it does. They can help leadership and employees formulate a strategic direction around common goals and values. Mission statements, their impact, value, important components, audiences etc have been studied by academics for many years.
In their paper Stakeholder Orientation in Cruise Lines’ Mission Statements, Lara Penco and Giorgio Profumo, analyzed the mission statements of 44 cruise lines. Their study focused on answering two research questions: 1. What are the specific characteristics of cruise mission statements? 2. Which are the most relevant stakeholders included in cruise mission statements? Is it possible to find a prioritization versus particular stakeholder groups?
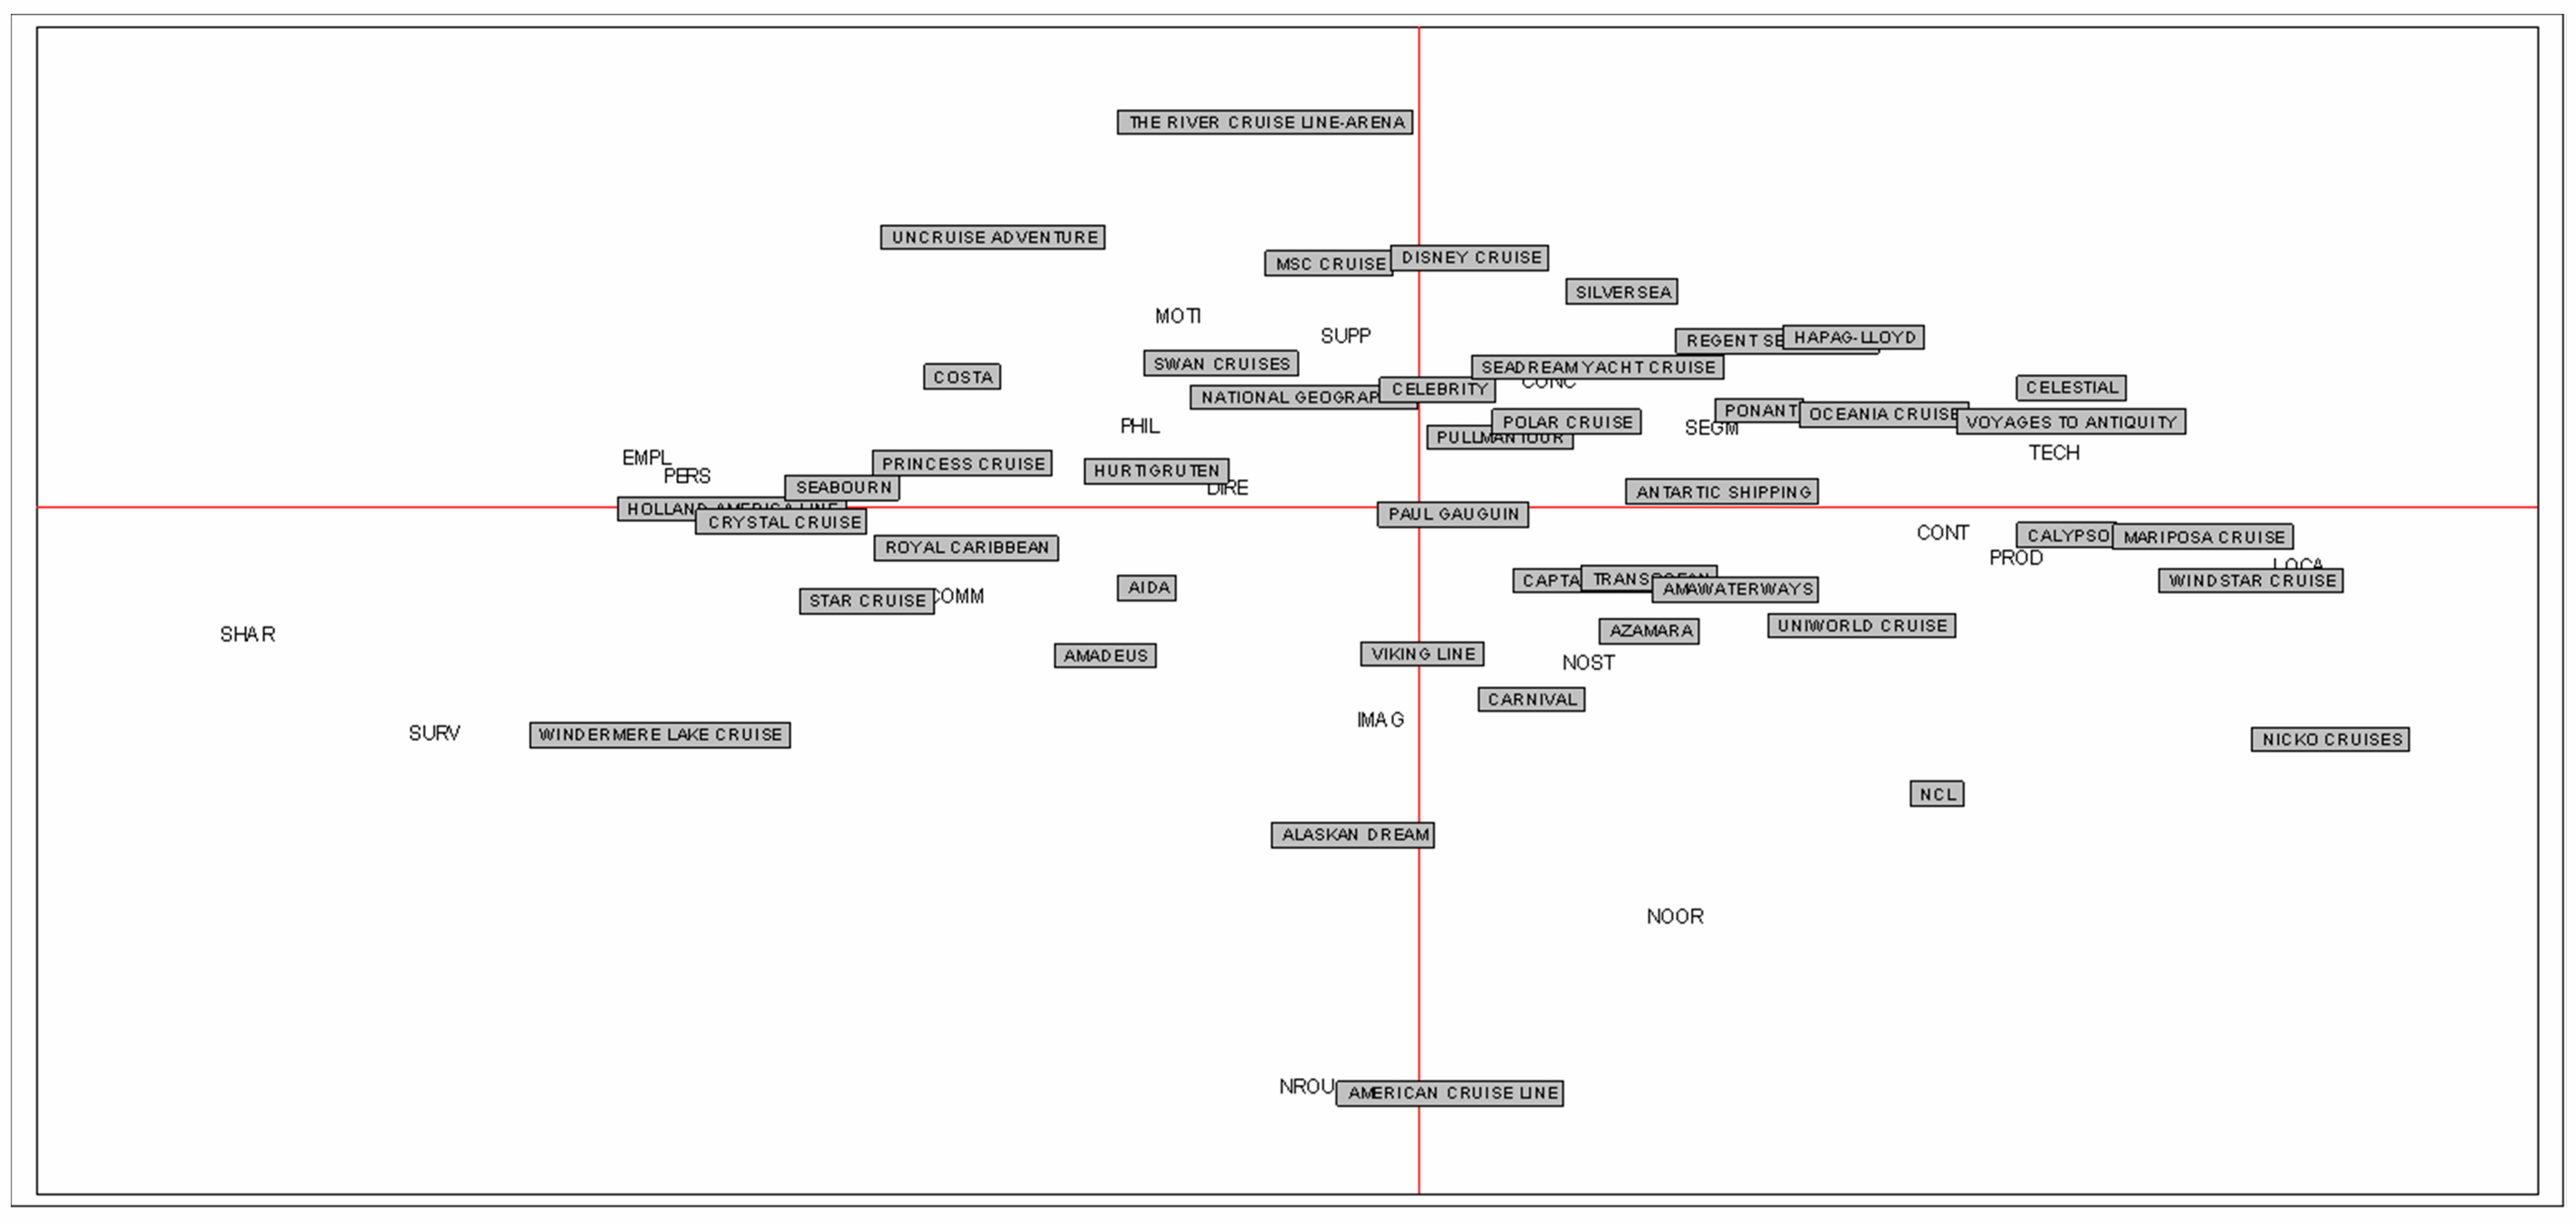
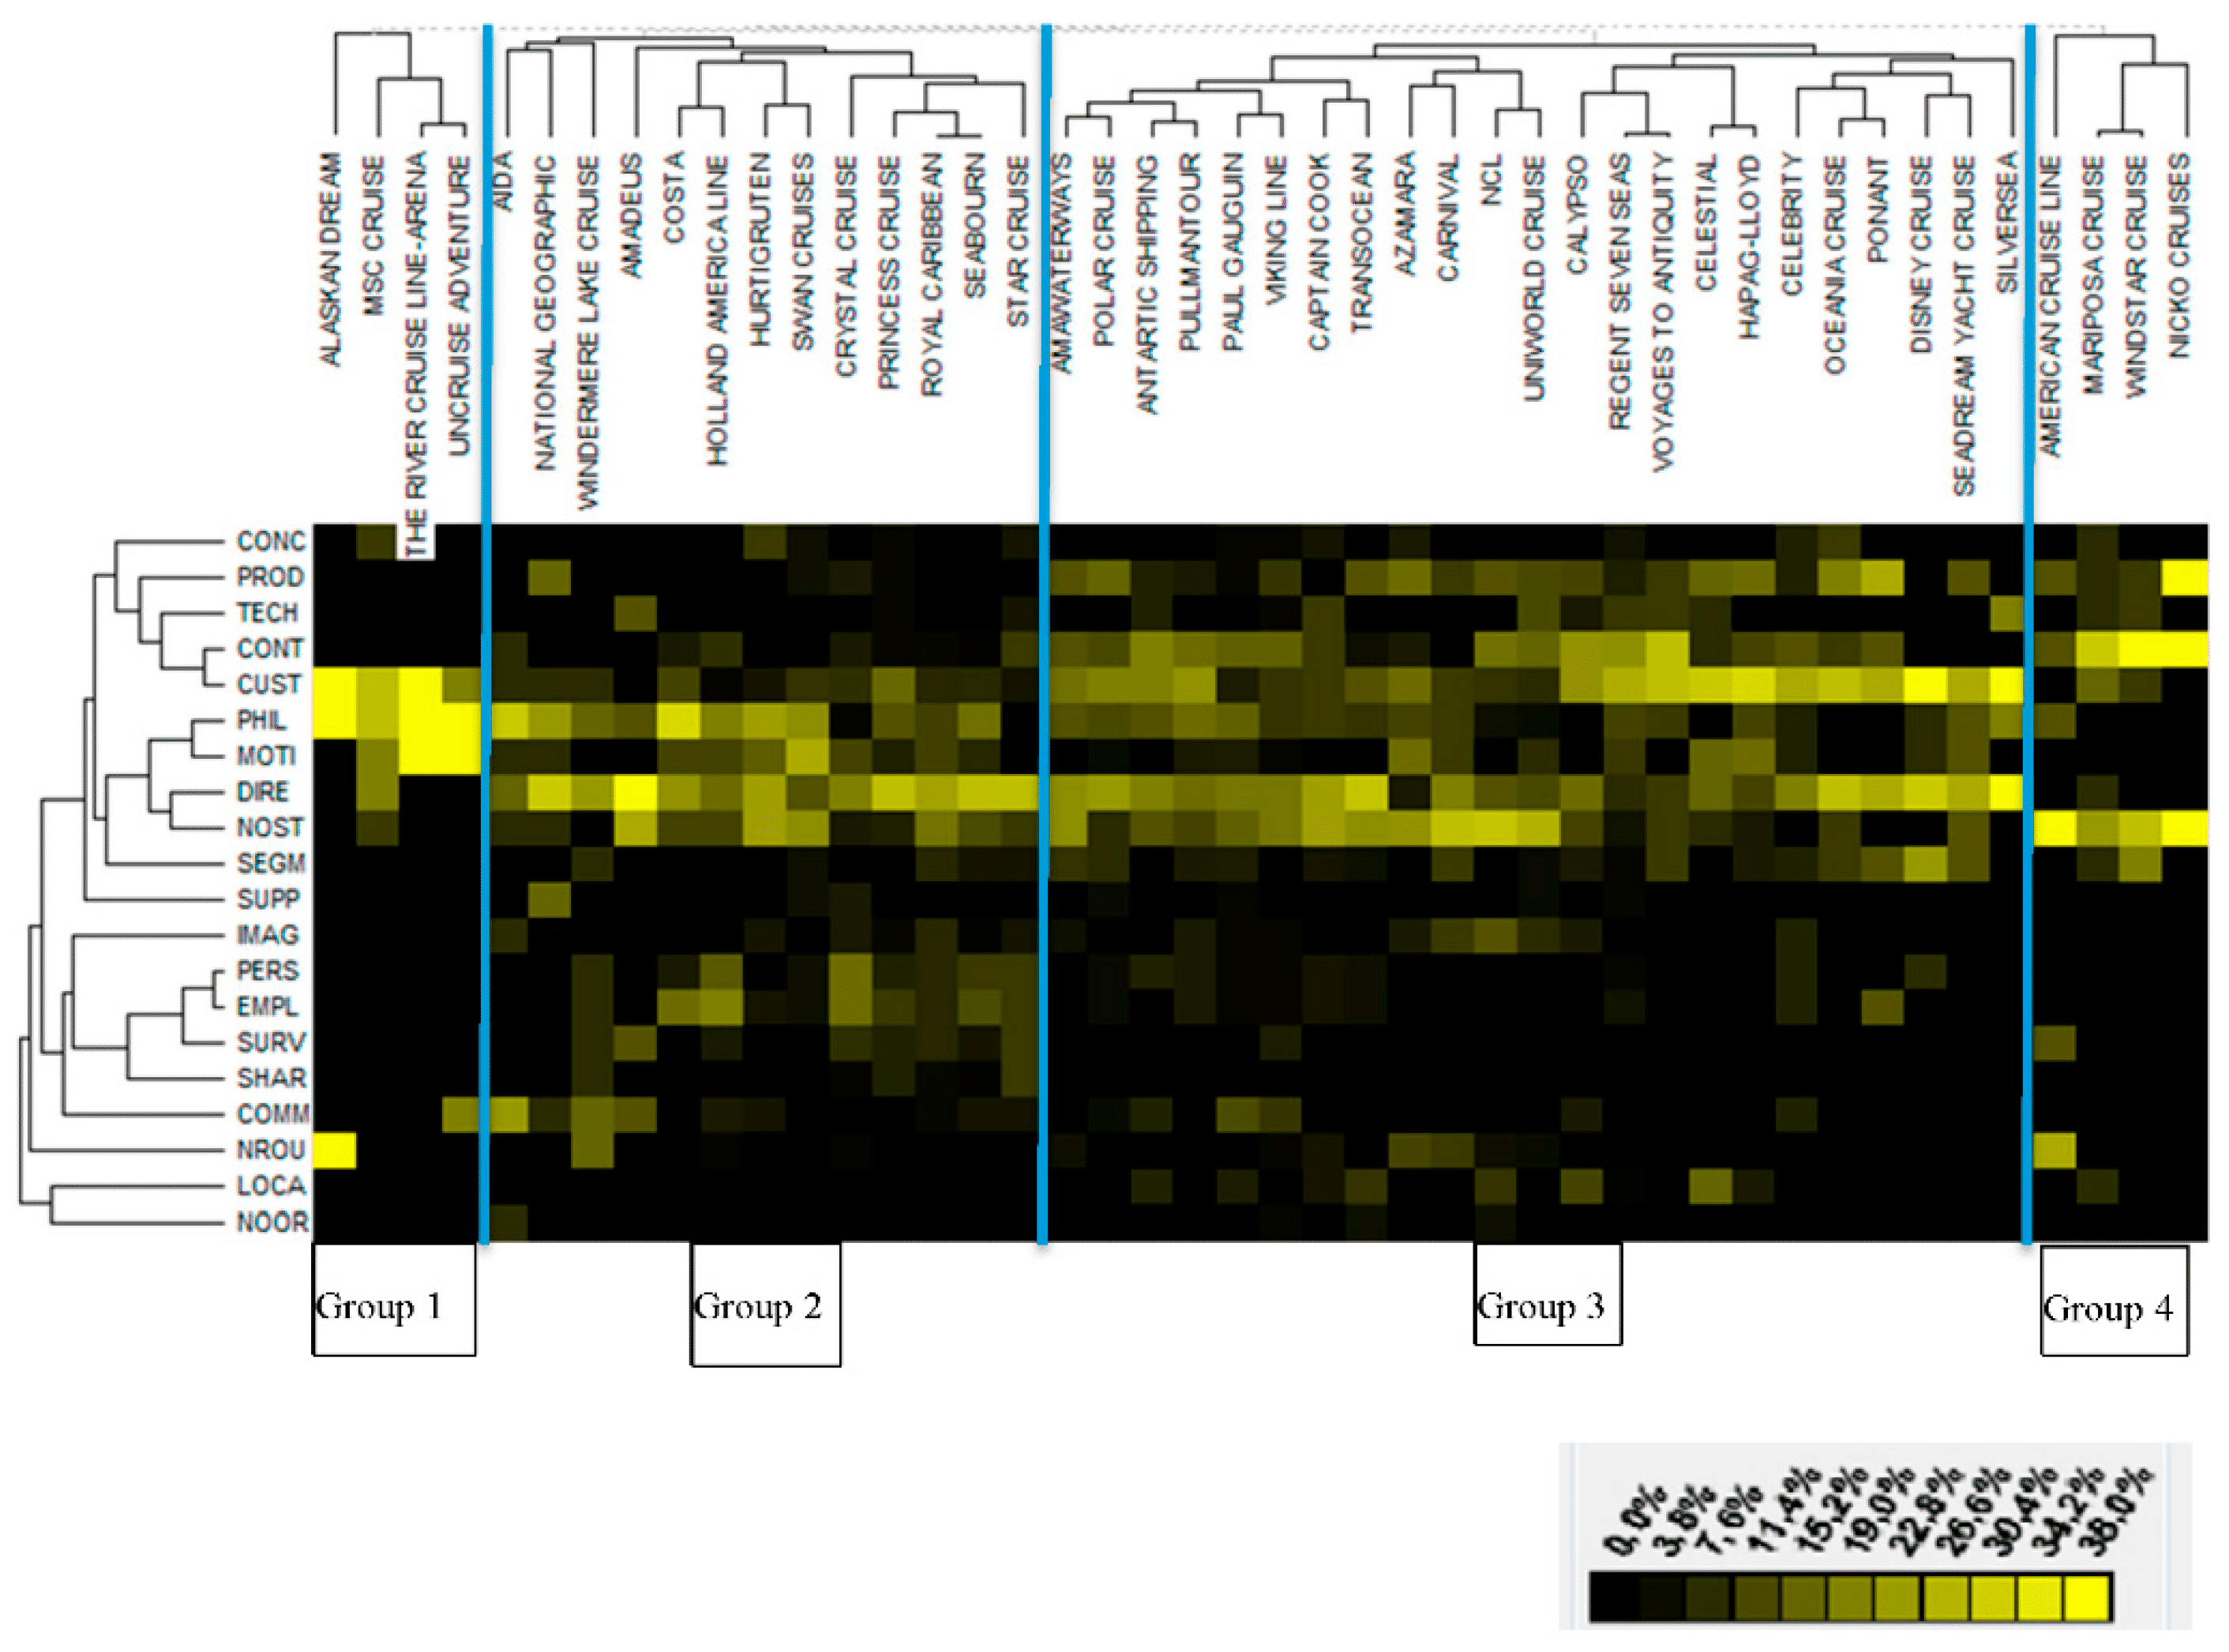
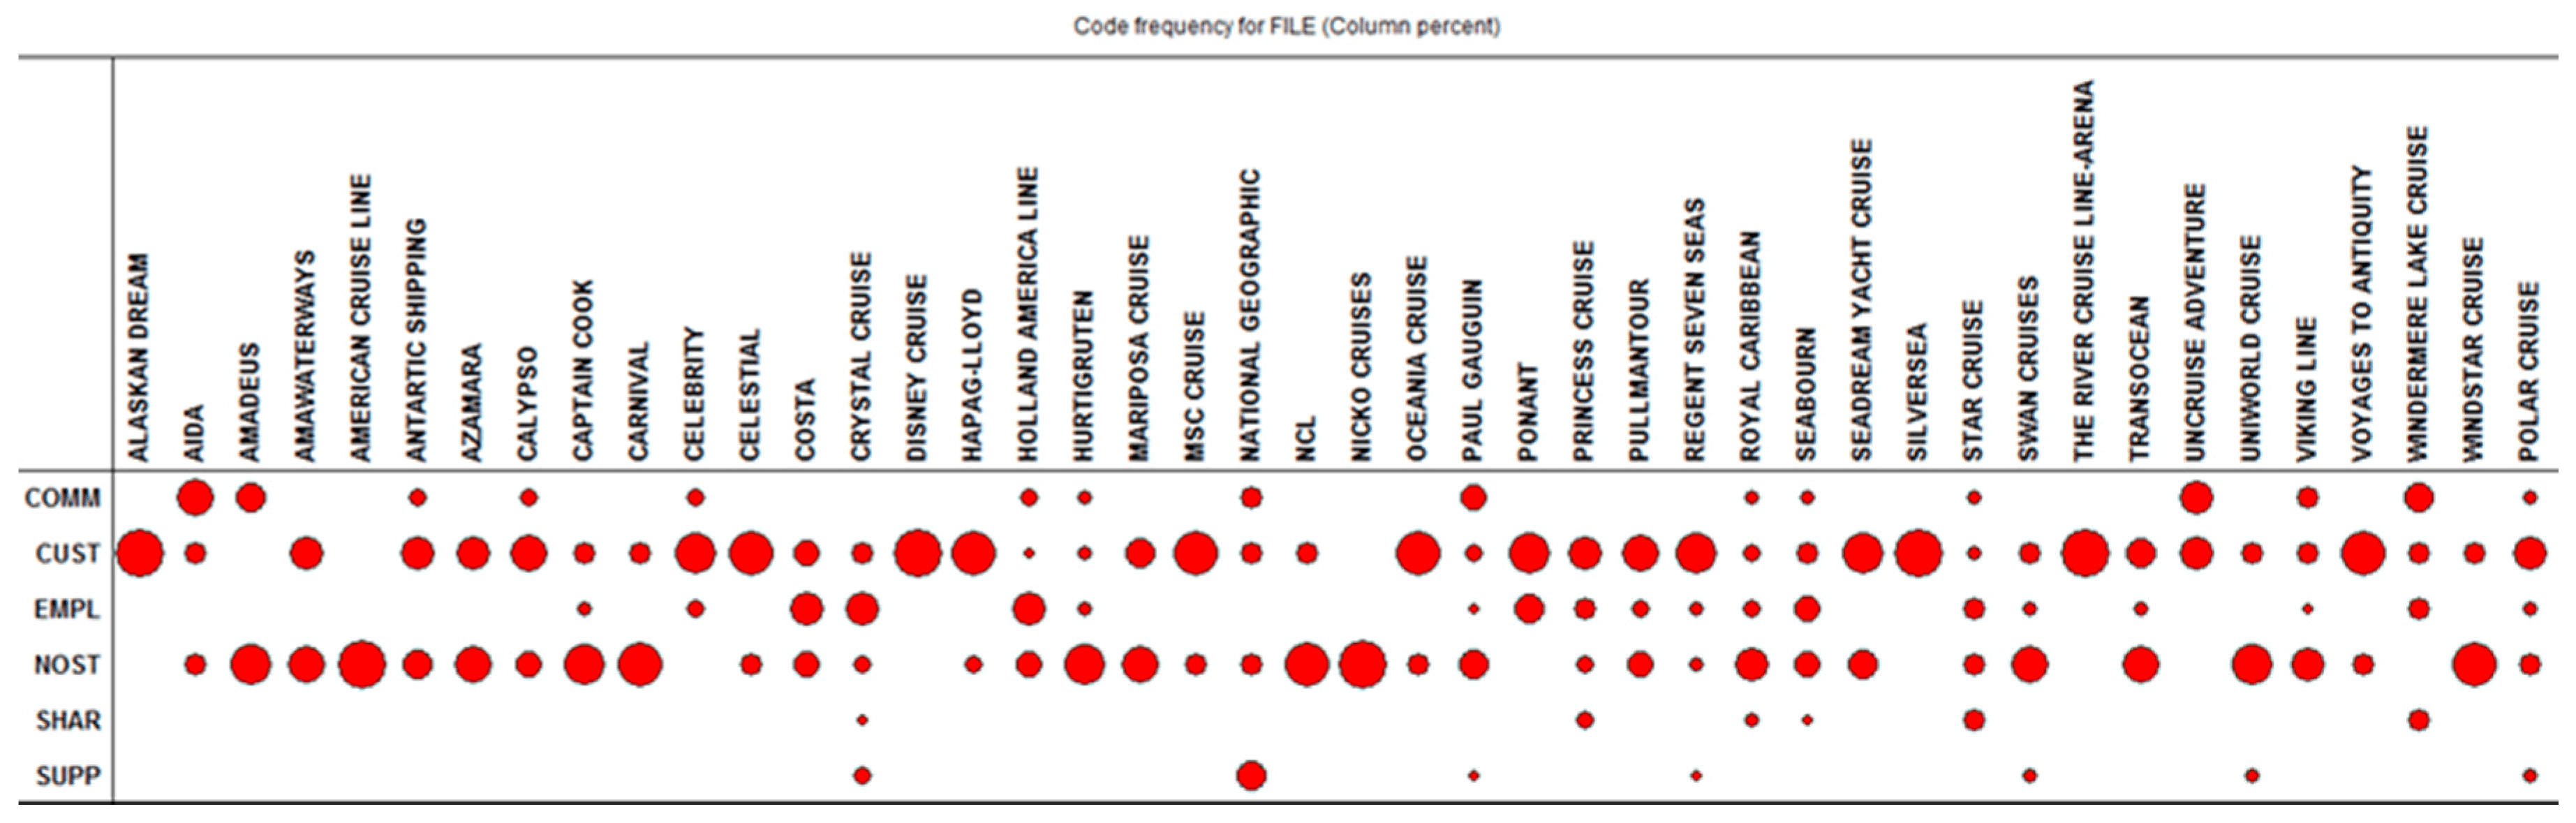
The paper drew our attention, and the reason we posted this blog, is because of the way it used QDA Miner to code and analyze the mission statements. And because of the different visualization features the authors used to show their analysis. These features included correspondence analysis, heat map plots, bubble charts showing code frequency related to the cruise lines.
The procedure of content analysis, the way they developed the codebook, and how they tested the reliability of the coding are all clearly explained by the authors and we believe can be easily understood by someone who is starting off using the software or considering whether to use the software for a future project.
You can read the complete paper by Penco and Profumo here