QDA Miner 5: New Tree Grid Display November 4, 2016 - Blogs on Text Analytics
QDA Miner 5 is now available. The latest version offers a variety of new features that allows you to directly import data from more sources, better analyze your data and gives you more options to display your results. In this Blog, we have highlighted some of the new features and provided a quick review as to how to use them.
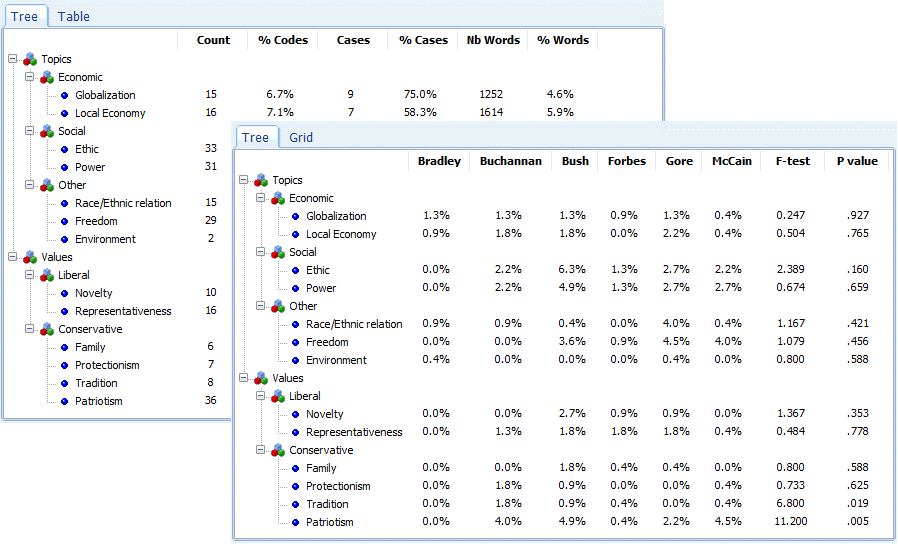
One of the new features in QDA Mine 5 is a new tree grid report format for the coding frequency and the coding by variable commands. It allows you to view the results organized according to the codebook hierarchical structure.
Here is how it works
First, go click on the analyze button at the top of the page.
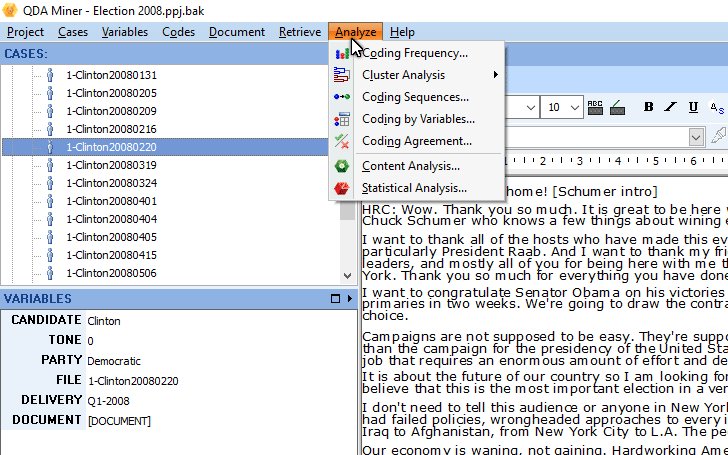
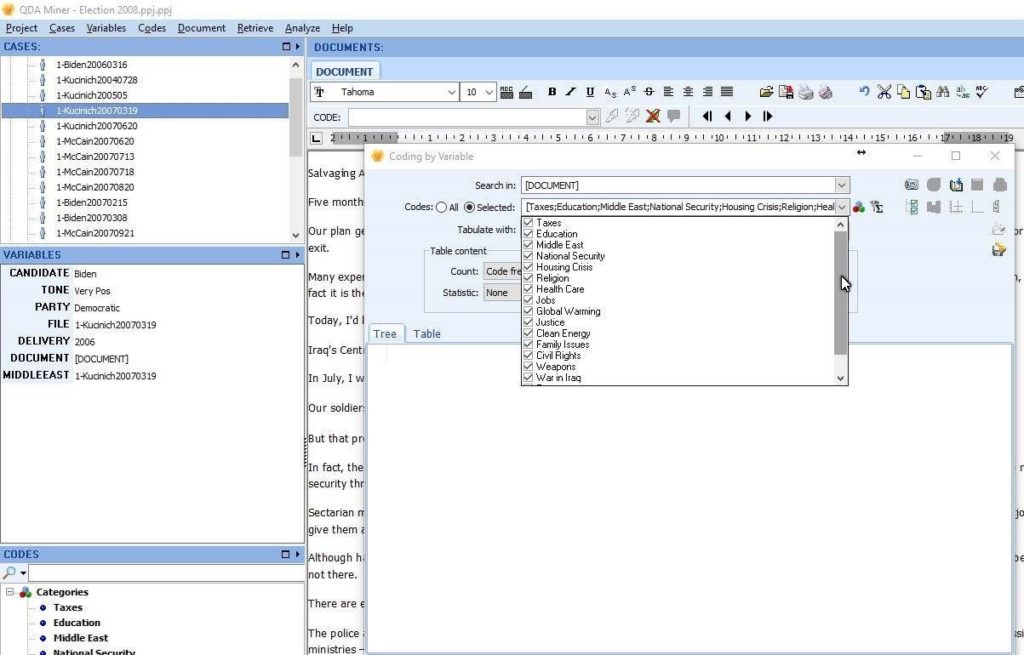
Next, click on Coding frequency or coding by variables. The feature works for both. Choose the one you want and check the boxes of the codes you want to display.
Click on search and you will be given a tree grid report format and you can also click on the table format if you prefer.
For a complete list of the new features of QDA Miner 5 go to the What’s New section on our website. https://provalisresearch.com/products/qualitative-data-analysis-software/qda-miner-whats-new/
If you have other suggestions for ways we can help you with the presentation of your data please tell us by leaving a message on this blog.