Is Sentiment Analysis in Qualitative Data Analysis Software Accurate? May 21, 2024 - Blogs on Text Analytics
We saw in our previous blog that QDA Miner and WordStat were much more scalable and quicker than other CAQDAS desktop tools. These tools nevertheless offers text analysis techniques designed to handle large datasets, such an automatic sentiment analysis and automatic theme extraction. This second blog aims to assess the quality of sentiment analysis engines available in these tools. However, comparing the performance across different CAQDAS tools can be very tricky. Atlas.ti compute sentiments using a three-point categorization (Negative, Positive and Neutral), while NVivo also includes a “mixed” category for context with both positive and negative elements. MaxQDA uses up to six classes, including a five-point scale and a “no sentiment” score. WordStat does not create a single classification but produce instead two independent scores, one for positivity and another one for negativity.
Choosing benchmarks that align to such a variety of classification methods can be challenging. We created four benchmarks using two publicly available datasets of online reviews (beauty product and Coursera reviews from Kaggle), airline reviews scraped from TripAdvisor, and the SemEval-2013 Task 2 twitter benchmark. For the three review datasets, we created benchmarks composed of 20,000 comments split evenly between very negative (score of 1) and very positive (score of 5) reviews. We include intermediary scores to reduce ambiguous assessment decisions. For example, should a score of four be considered mixed or positives? By selecting clear positive and clear negative items, we could at least assess all four engines at their ability to identify those extreme opinions.
For WordStat, we classified results using a rudimentary method by subtracting the negativity score from the positivity score, classify results above zero as positive, below zero as negative and equal to zero as neutral.
We computed a first accuracy score by dividing the correct classifications by the total number of items classified as positive or negative, ignoring items classified as neutral or mixed. These results are presented in table 1 below, with the best scores displayed in bold and the lowest ones in red.
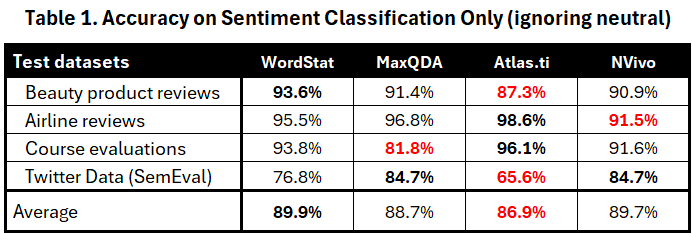
This accuracy metric suggests comparable performances with overall accuracy scores between 86.9% and 89.9%. Each tool achieves the highest score on at least one of the four benchmarks suggesting that each tool may excel on some types of data but perform less well on others. For this reason, any average performance score seems too dependent on the choice of benchmarks to be a reliable indicator of overall performance.
While the above statistics may seem encouraging, we believe they are misleading. Since our benchmarks consisted of the comments with the lowest and highest satisfaction scores only, categorizing them as neutral or mixed will likely yield classification errors. Table 2 assesses the coverage of those four engines by reporting the percentage of items classified as either positive or negative.
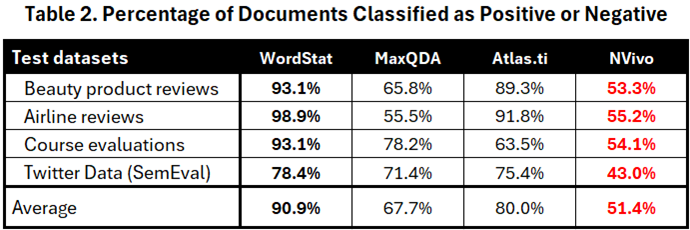
NVivo has the lowest coverage, categorizing nearly half of the items as either neutral or mixed, resulting in a coverage score of only 51.4%. MaxQDA also has an overall low coverage at 67.7%, while Atlas.ti categorize only 20% of items as neutral, achieving a coverage of 80.0%. WordStat had the highest coverage at 90.9%, with only 9.1% of the items scored as neutral.
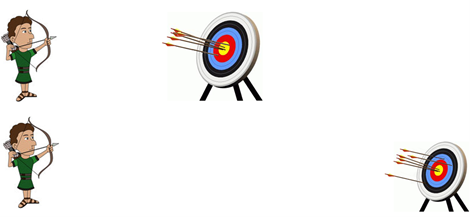
If a sentiment engine readily discards half of the items as mixed or neutral and classify only the most obviously positive and negative items, one should not be surprised to observe such high accuracy scores. The figure 1 below illustrated why the above scores in table 1 may be deceitful. While the archer at the top clearly achieve better accuracy, it would be hard to claim he is the best archer because of the disparity in the difficulty level they both face.
Figure 1. Who is the most accurate archer? Who is the best archer?
Since the benchmarks were chosen to select only the most extreme scores, we could consider everything classified as “neutral” or “mixed” to be incorrect. This is not to minimize or negate the existence of comments containing both positive and negative elements. They certainly exist and may actually be the rule more than the exception, however, categorizing them too readily as mixed may likely result in ignoring the clear imbalance between the positives and the negative indicators and fail to identify the real tone of the comment, a nuance that a human would easily recognize. We also recognized the possibility that some items may indeed be mixed or neutral, but they are less likely to occur in these extreme datasets. Here are some examples of comments categorized as neutral by MaxQDA and Atlas.ti and as Mixed by NVivo.
Unbelievable service AF 1533 & AF 008 we got noticed about for a 15′ minute delay 2 hours before check in. Poor service , lost baggages for all of us, etc.
Poor Customer service. Horrible service very rude personnel not sympathetic at all. Do not use this company if something goes wrong they will wash their hands completely.
And what about those comments from very satisfied customers also categorized as mixed or neutral by MaxQDA and NVivo:
Reliable Reliable, no-nonsense service. Relaxed & friendly staff. Punctual. Economy comfort seating is great.
Friendly staff Super friendly staff & exceeded my expectations regarding service. Not my last time to fly with Aer Lingus
We found that long comments were particularly susceptible to being classified as mixed or neutral by MaxQDA and NVivo. This is likely due to the higher probability of encountering both positive and negative words in lengthy comments, even when there is a significant discrepancy between the two. For example, in one long comment, WordStat identified 74 negative elements and only 4 positive ones. Despite this, the comment was categorized as mixed by NVivo and neutral by Atlas.ti and MaxQDA. Same thing for another clearly negative comments containing 50 indicators of negative emotions and only one positive element.
Table 3 presents adjusted accuracy measures, calculated as the percentage of correct predictions out of the total number of items.
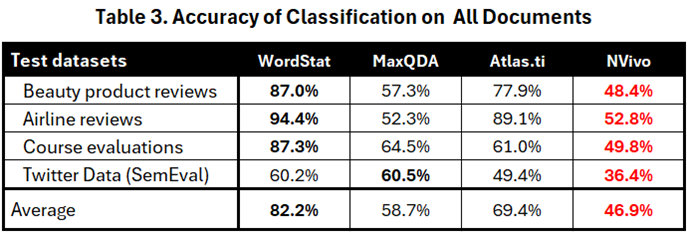
While table 1 did not show any substantial differences in scores, the new table clearly shows that WordStat achieved the best overall performance. Atlas.ti followed in second place with adequate performance on product reviews, but much lower performance on course evaluations and Twitter data. NVivo had the lowest average score of 46.9%, followed by MaxQDA. The adjusted scores also reveal significantly lower performance on Twitter data for all four engines.
One aspect of sentiment classification often neglected by researchers is the inherent bias of different engines. It’s important to understand that sentiment analysis is frequently used to create an overall sentiment index, allowing an organization to monitor over time sentiment toward its organization, its services or its products. Our choice of balanced benchmarks aims to avoid favoring any engine that might disproportionately identify more items as positive or negative. There is also a general tendency for satisfaction scores in surveys to be skewed toward positive evaluation, so an engine that overestimates positive sentiments might be unfairly advantaged over those with neutral or negative biases. Balanced benchmarks not only prevent this unfair comparison but also help identify such biases.
Table 4 shows the result scores obtained by subtracting 50% from the highest absolute percentage after excluding the “neutral” and “mixed” classifications. For example, if an application’s sentiment classification results in 62% positives and 38% negatives, the bias score is +12%. Conversely, if 57% are negative and 43% positive, the bias score is -7%.
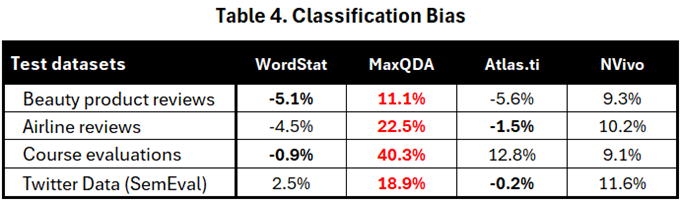
Table 4 clearly shows that MaxQDA consistently exhibits the strongest bias, often presenting an overly positive picture of reality. In the course evaluation benchmark, 90.3% of items classified as positive or negative were deemed positive, while only 9.7% were classified as negative. NVivo also demonstrates a clear positive bias, ranging from +9.1% to +11.6%. In contrast, the other two tools provide a more accurate representation. WordStat’s bias varies between -5.1% and +2.5%, while Atlas.ti generally stays close to the 50% mark, with the exception of the course evaluation benchmark, where it shows a positive bias of +12.8%.
One might rightly argue that the choice of a binary classification may unduly favor tools with few or no “neutral” scores. To address this potential bias, we built three new benchmarks using the first three datasets, selecting an equal number of review scores ranging from very unsatisfied (score of 1) to very satisfied (score of 5). We excluded the Twitter data since it consisted only of binary classifications. Each of the three benchmarks contains 10,000 reviews, with 2,000 randomly selected reviews for each score from the full dataset.
Given that WordStat produces a numerical sentiment score with no theoretical limits, while the other software outputs three (Atlas.ti), four (NVivo), or six (MaxQDA) classes, we determined that the Spearman Rho correlation would be the best comparison method. This statistic provides a more robust measure of how strongly the sentiment engine results correlate with the star ratings assigned by customers. It focuses on the direction of change (increasing/decreasing) rather than the exact magnitude, ensuring a fair comparison between sentiment engines with different output formats.
Table 5 presents the correlation results for all four software. The results from these three benchmarks show that the sentiment scores obtained by WordStat had the highest correlation with the star ratings. Atlas.ti ranked second, while NVivo’s sentiment results had the lowest correlation with the ratings.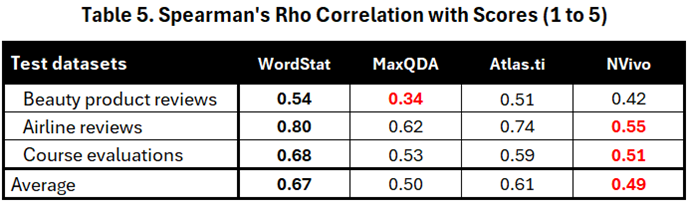
This last experiment rules out the possibility that the benchmarks, consisting solely of very negative and very positive scores, would unduly favor engines with higher rates of classification and fewer neutral and mixed results. Engines that are most accurate at identifying these extreme positions also show the highest correlation with the full range of opinions.
As the publisher of WordStat, we acknowledge that making public comparisons might be perceived as biased. Our initial intention was not to demonstrate the superiority of our sentiment analysis tool but to emphasize the importance of assessing tools critically rather than blindly trusting their results. Long before sentiment analysis was integrated into CAQDAS tools, we were skeptical about the growing popularity of sentiment analysis in text analytics platforms from companies like Clarabridge, Lexalytics, and Bitext. Some of these companies claimed high accuracy for their tools, even suggesting they could achieve similar results across any data type and domain. We knew this was unrealistic. It took us years before deciding to release our own sentiment dictionary, as we were initially reluctant to do so. We have always emphasized the need for customization rather than using the dictionary as is. Results in the above comparisons suggest that our dictionary performs well on product and service reviews. However, consider the 60.2% accuracy on Twitter data shown in Table 4—only slightly better than the 50% accuracy achievable by chance. What about its performance on employee evaluations, healthcare service reviews, or political news? The only way to determine its efficacy in these areas is through rigorous testing on such datasets.
We contend that WordStat stands out for sentiment analysis due to its transparency—unlike black box engines, users have the flexibility to customize our dictionary or even develop their own. This level of customization isn’t available in the other three CAQDAS tools. Over the years, we’ve invested significant effort in developing and testing our sentiment dictionary, expanding its lexicons of positive and negative words, analyzing the impact of negations, and addressing double negations. However, even with these advancements, we acknowledge that there are situations where we wouldn’t fully trust its results. That’s why we continually remind our users not to rely solely on our dictionary as is and emphasize the importance of customization or thorough testing.
By making such comparisons public, we hope to inspire our competitors to enhance their sentiment analysis engines, striving for improved accuracy and reduced biases. As for us, we remain committed to testing our sentiment dictionary on new datasets, diligently identifying any areas where it may underperform. If possible, we will enhance its performance, or alternatively, we will transparently communicate any limitations to our users.
As a software development company, it would have been far simpler for us to adopt the approach of our competitors and license an existing sentiment analysis API or utilize established NLP libraries in Python or R. This would have enabled us to swiftly produce results across multiple languages while disregarding any potential shortcomings or, worse, keeping them concealed. We understand that many users rely on these black box engines, and expecting them to critically evaluate the accuracy of the results may be unrealistic. However, we believe we have a responsibility to our users not to mislead them. With numerous sentiment “solutions” flooding the market, many of which have unknown performance levels, it is imperative to exercise caution. While some solutions may be effective, our experience has shown us that others fall short. Therefore, there is an urgent need for thorough evaluation to ensure users are not misled.
Update: What about Sentiment Analysis with Generative AI?
In early 2024, several months after this blog was published, we tested several Large Language Models (LLMs) to assess their capability in identifying sentiment on customer feedback and the challenging SemEval-2013 Task 2 Twitter benchmark.
While we were proud of WordStat’s relatively strong performance compared to other qualitative analysis software, we had to concede that, with very few exceptions, these LLMs outperformed us, often by a wide margin. For instance, on the Beauty product reviews dataset, where WordStat achieved an accuracy of 87.0%, engines like OpenAI, Gemini, Claude, and Mistral achieved remarkable scores between 99.4% and 99.6%. Perplexity was the least performing engine, but still yielded a respectable score of 95.5%.
The difference was even more pronounced on the much more difficult SemEval-2013 benchmark. WordStat achieved an adjusted score of 60.2%, coming just below MaxQDA’s 60.5%. However, four of the five tested LLMs were able to obtain scores not only higher than ours but also higher than the winning model of the 2013 competition. Scores were: Gemini at 82.6%, Mistral at 83.9%, OpenAI at 87.2%, and Claude at 89.2%. Again, Perplexity obtained a score of 63.5%, just a few percentage points above what we achieved with WordStat.
The Cost of Superior Accuracy
While we spent years developing and refining our sentiment dictionary, we must acknowledge the clearly superior performance of LLMs for this task. However, this amazing performance comes with a cost.Consider the speed difference: WordStat can perform sentiment analysis on the 50,000 airline reviews in less than 20 seconds. The processing time using LLMs for the same task took between 1 hour 40 minutes and 4 hours, depending on the model. There is also a significant financial cost involved, as processing this amount of text represents a total number of tokens close to 8 million.
Nevertheless, recognizing the need for high-accuracy options, we decided to implement an LLM-based sentiment analysis feature in both QDA Miner and WordStat. This allows users to choose the right tool for the job: when high accuracy is crucial and cost is not an issue, users can leverage the LLM capability to perform sentiment analysis on their dataset.