

Net Promoter Score and Text Analytics
Net Promoter Score
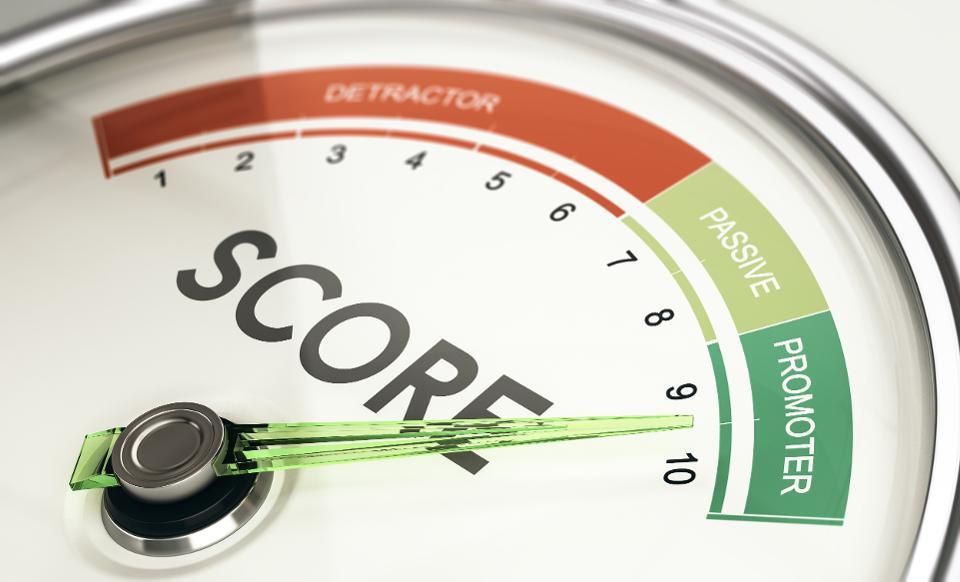
Companies are always trying to find easy and accurate ways to measure customer satisfaction or customer sentiment. In the last decade, Net Promoter Score (NPS) has emerged as a favorite. Many companies have adopted it as a standard. The one-question survey developed by Fred Reichheld, Bain and Company, “How likely are you to recommend this product/brand/service to your friends or colleagues,” is straightforward, as is the 0-10 scoring system that accompanies it. Companies can ask the question and over time see how their score moves up or down. There are detractors to NPS to be sure. No system is perfect. Even the creators of NPS agree the score isn’t complete by itself. You need at least one verbatim to go with it. “Why did you give us this score? ”This is what allows you to make NPS actionable. This is what gives you the information to make changes to further delight promoters or to help move neutrals or detractors towards becoming promoters of your brand.
How Text Analytics Software Adds Value to NPS
Text analytics is a process that uses natural language processing techniques to quickly extract high-quality information from large amounts of text. Text analytics can help you deal with all the why’s that NPS doesn’t show. It gives you a sense of the content of the why’s.
With Text Analytics Tools like WordStat, you can automatically extract main themes from customer verbatims using an exploratory text mining approach. The Clustering and Topic Modeling features of WordStat enable you to quickly extract the top 30, 40, 50 topics your customers are talking about across the full 0-10 score or just promoters or detractors. Extracting the main themes from your verbatims can provide useful information by revealing issues, successes, or other opinions of your products or services. You can also use the Crosstabulation function of WordStat to see the correlation between topics and NPS and quickly identify the reasons why customers gave a Detractor, Promoter, or Passive Score. At any time, you can drill down to the source in order to retrieve original text segments associated with a topic to see what customers are saying. You can also do a Crosstab between NPS and verbatim words or phrases to quickly identify words or phrases more often associated with Detractors, Passives, or Promoters.
WordStat also offers you the possibility to apply premade categorization dictionaries or create a custom categorization of keywords, phrases, proximity rules, regular expressions, etc. which allow you to measure specific dimensions such as sentiment (positive, negative, neutral), emotions, predefines themes, etc. Building comprehensive and reusable dictionaries tailored to your subject matter is a great way to automate the categorization process allowing you to save a considerable amount of time. The dictionaries also allow you to implement a standardized measurement so you can identify the changes in customers loyalty over time for each predefined theme. By using Crosstabulation, you can see the relationships between predefined topics and NPS, and identify which topics are more correlated with Detractors or Promoters.
Text mining works well if you have certain amounts of text data that allows the NLP algorithms to be more efficient in finding patterns between words and between phrases. If you have a small amount of text data, say less than a thousand, a qualitative coding approach will likely be more appropriate.
By using a computer-assisted qualitative analysis tool like QDA Miner, you can speed up the qualitative manual coding process by at least 10x. In QDA Miner, you can create categories/codes (a codebook) and code/tag the comments of the NPS verbatims based on those codes. To create a list of codes you want to measure, you can, for example, start with your own experience as to what you expect to be the drivers of your business: what are the top 5 detractors and the top five promoters and how do they relate? QDA Miner has many features to help you perform qualitative coding easily and quickly. You can use the Cluster Retrieval tool of QDA Miner to automatically group similar responses and make coding much faster. The Query-by-Example feature lets the coder focus on specific text segments or responses and finds other comments that are similar. The Code Similarity function allows you to quickly identify sentences or paragraphs that share some similarities with existing coded segments in the current project or those stored in another coded project. Such a tool is especially useful on partially coded projects to quickly identify and code text segments in un-coded documents. Once the coding process is done, you can look at how the codes relate to each other and how they relate to your NPS data. You can set 0-10 scores as variable values and easily recode them into Detractors (0-6), Passives (7-8), and Promoters (9-10) and see how Detractors tend to be talking about these five issues and how that compares with your net Promoters or Passives. You can reuse and update your codebook with each survey as you get more data and see how the comments change in relation to your NPS data and the actions you have taken to make improvements, introduce new products or services, redesign your website, etc. You now have a learning tool and not just a score.
Visualize Your Customer Experience Story
Numbers on a chart that move up or down over time are fine for showing snapshots but they don’t tell the whole story. Another feature of text analytics (QDA Miner & WordStat) software is the ability to use a wide range of charts, graphs, comparative analysis formats to let you visualize your results. You can also use the Geocoding and Mapping feature of QDA Miner and WordStat to plot where your comments originate if this information is available. This allows you and your audience to see the data in context and see how the quantitative and qualitative data related to each other, how it changes over time, and is impacted by different cultures, geographies, ages, and gender. All of this creates more value for your NPS survey.
For additional explanations of when to use QDA Miner and when to use WordStat to analyze open-ended responses, please reference our white paper Coding and Analyzing Open-Ended Questions. Many of the techniques described in that paper will be applicable to analyzing NPS verbatims.
References
Reichheld, F. F. (2006) ‘The ultimate question: Driving good profits and true growth’, Harvard Business School Press, Boston.